
GEONAVIGATE / RESOURCES / GEOCHEMISTRY
Stable isotopes: delta values and ratio comparisons
Calculate delta values and ordered isotope-ratio factors, then separate the numerical comparison from geological interpretation.
Start with the ratio, reference and sampled material
Isotope delta compares the same isotope pair in two materials. For carbon, R may denote the number ratio ¹³C/¹²C; for oxygen, it may denote ¹⁸O/¹⁶O. Write the pair and reference scale alongside every result. A carbon ratio and an oxygen ratio are different quantities. The calculations below use one hypothetical pair on one common scale.
Delta is a dimensionless relative difference: δ = R/Rref − 1. The symbol ‰ represents 0.001, so δ = −0.010 equals −10 ‰. If d denotes the numerical value quoted in per mil, d = 1000(R/Rref − 1). These are two ways to express the same result, not two different definitions. See NOAA’s calculation explanation and Coplen’s reporting guidance.
Worked example: two negative values, one positive contrast
Invent sample A with R/Rref = 0.990 and sample B with R/Rref = 0.980. Both ratios are positive. A gives 1000 × (0.990 − 1) = −10 ‰; B gives −20 ‰. A has the higher heavy-to-light ratio, even though both delta values are negative. The difference dA − dB is +10 per mil; it is not 10 percent of the sample’s atoms.
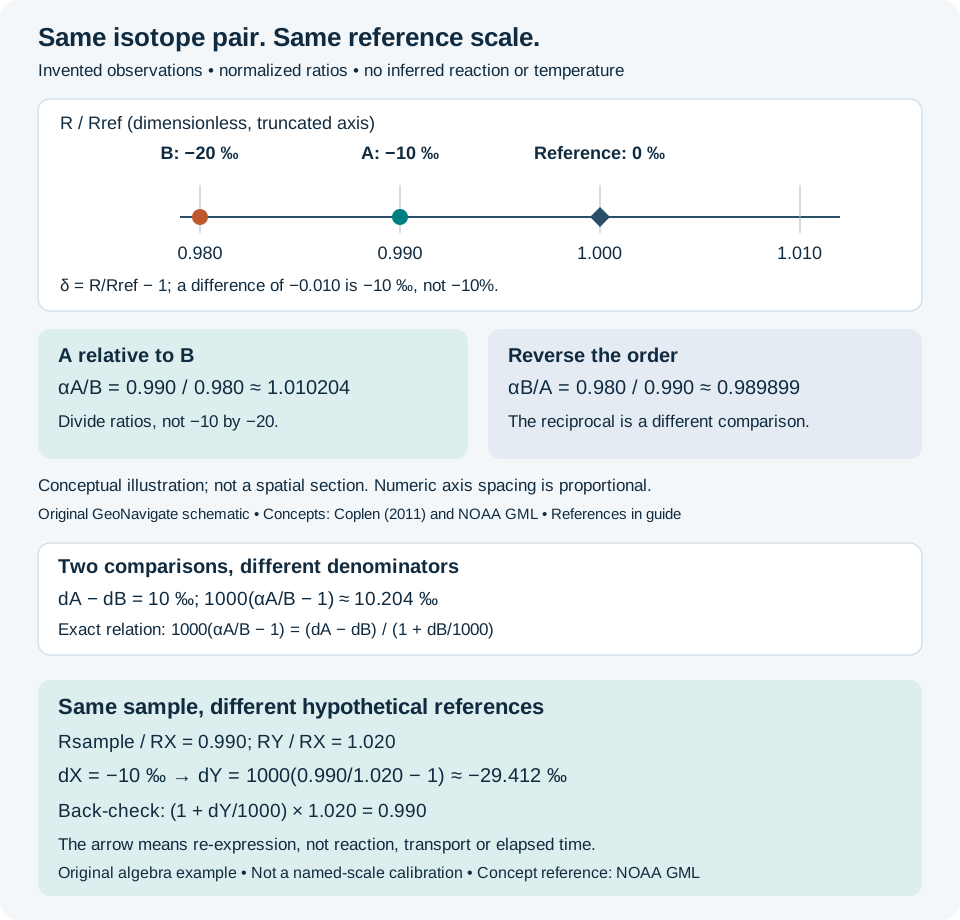
The ordered isotope-ratio factor is αA/B = RA/RB = 0.990/0.980 = 1.010204… . Equivalently, use (1000 + dA)/(1000 + dB). Reversing the order gives αB/A = 0.980/0.990 = 0.989899… . Do not substitute the delta-value quotient (−10)/(−20) = 0.5: that divides differences from a reference, not the isotope ratios themselves.
Change the comparison
If B instead has dB = −10, then its normalized ratio is 0.990 and αA/B = 1 exactly. If B was reported against a different reference scale, neither quotient above is justified until both measurements are converted consistently. The normalized values in the drawing do not specify an absolute Rref and cannot be read as absolute isotope abundances.
A ratio contrast does not identify the process
Isotope fractionation may accompany phase changes, reactions or transport. Equilibrium and kinetic mechanisms require different assumptions. Kendall and Caldwell explain these distinctions in their 1998 chapter, sections 2.2–2.3. Our A and B are simply invented observations: no reaction, temperature or equilibrium relationship is stipulated.
For a geological application, identify what was analysed: bulk carbonate, a selected cement generation, organic matter, gas or water. A bulk sample can combine components. Petrographic evidence of diagenesis can change which event a mineral records. Similar isotope values can have more than one origin; an excursion is not automatically a synchronous chemostratigraphic marker. Compare stratigraphic context, preservation and independent evidence before correlating.
Carry enough information to check the interpretation
- Retain sample identity, sampled phase, depth/datum and preparation history.
- Record the isotope pair, scale, laboratory calibration and reported uncertainty; do not compare tiny contrasts without those uncertainties.
- Keep the measured value separate from an inferred source, reaction or temperature.
- Use radiometric dating for the separate question of decay-based age interpretation. A stable-isotope delta value alone is not a clock.
For wellsite samples, record possible mixing or drilling-fluid contamination. The example supplies no formation-fluid diagnosis, pressure forecast or unique gamma-ray response. The Oilfield Glossary also distinguishes isotope fractionation from hydrocarbon product separation.
Sources and credit
Concept references: NOAA Global Monitoring Laboratory, Determining Delta Values; Tyler B. Coplen (2011), Guidelines and recommended terms for expression of stable-isotope-ratio and gas-ratio measurement results, DOI 10.1002/rcm.5129; Carol Kendall and Eric A. Caldwell (1998), Fundamentals of Isotope Geochemistry, USGS publication record, DOI 10.1016/B978-0-444-81546-0.50009-4. Relevant source sections were checked 28 October 2026.
Original GeoNavigate explanation, hypothetical calculations and vector artwork; no source figure, measured dataset or external expert review is claimed. Browse Geology Guides, explore Chaser Geological services, or contact the team.
Worked check: subtraction versus relative ratio difference
Keep A at −10‰ and B at −20‰ on the same scale. Their numerical delta difference is 10‰. The ratio factor is αA/B = 990/980; therefore 1000(αA/B − 1) = 10.2040816…‰. Algebra gives the exact relation (dA − dB)/(1 + dB/1000), with d expressed numerically in per mil. Here the denominator is 0.980, not one. The discrepancy is about 0.204‰; rounding it away may or may not be acceptable for a particular uncertainty budget.
The subtraction compares two offsets from the common reference. The relative ratio comparison instead uses B as its baseline. Label the quantity before comparing laboratory tables or model outputs. Neither calculation alone establishes equilibrium or identifies a reaction. Concept equation: Kendall and Caldwell, Fundamentals of Isotope Geochemistry, §2.2.2; original arithmetic with invented inputs. Compare isotope fractionation and the existing ratio diagram above.
One sample, two hypothetical references
A delta value includes a comparison baseline. Changing that baseline can change the reported number without changing the sample. This separate algebra exercise uses one isotope pair and two invented reference ratios X and Y. It is not a VPDB–VSMOW conversion or a laboratory calibration recipe.
Convert the ratio before expressing delta
Stipulate Rsample/RX = 0.990 and RY/RX = 1.020. Let dX and dY denote numerical delta values in per mil. Relative to X, dX = 1000(0.990 − 1) = −10. Relative to Y:
- Rsample/RY = (Rsample/RX)/(RY/RX) = 0.990/1.020 = 0.970588235… .
- dY = 1000(0.970588235… − 1) = −29.411765… ‰.
- Inverse check: (1 + dY/1000) × 1.020 = 0.990, recovering the original normalized sample ratio.
In general, if k = RY/RX is known, dY = (1000 + dX)/k − 1000. Here Y itself is +20‰ relative to X. Simply subtracting 20 from −10 gives −30‰, about 0.588‰ below the exact result. That discrepancy is an arithmetic consequence of division by 1.020; it is not evidence of fractionation in the sample. The expanded full-size ratio schematic records the calculation.
What must accompany a real comparison
Keep the isotope pair, sample phase, reporting scale and laboratory uncertainty with the result. A hypothetical k is not a substitute for an established scale relationship and its uncertainty. Actual scale realization and normalization can require reference materials and documented calibration procedures. Do not infer geological alteration from a numerical difference until reporting conventions are reconciled.
Compare isotope delta, oilfield usage and isotope fractionation. Concept definition: NOAA GML, Determining Delta Values, checked 30 October 2026; reporting context: Coplen (2011), retained from this guide. The transformation and values are original educational calculations, not measured samples or an expert review. See Chaser geological services or contact the team.