GEONAVIGATE / RESOURCES
Regional geology studies
Geological evidence, formation maps and 3D / VR models for southeast, southwest, west-central and central Saskatchewan and southwestern Manitoba.
West-central & central Saskatchewan
Kindersley · Dodsland · Lloydminster · Saskatoon · Humboldt · Watrous · Melfort
A continuous regional study covers 110°W–103.5°W, 51.25°N–53.5°N, with separate west-central and central camera views. Explore 45 supported display layers, 36 gross intervals and 7 unconformity layers on a 2 km regional grid.
The study examines Viking shelf and shoreface architecture around Kindersley–Dodsland, stacked Mannville river, estuary and delta systems around Lloydminster, and conventional Bakken heavy-oil sands around Coleville, Hoosier and Cactus Lake. Central Saskatchewan chapters examine marine sands, carbonate and evaporite architecture, preservation, seal and charge. Each nearby reservoir setting includes the evidence, conditions to test and findings that would weaken the interpretation.
Inspect 346 official petroleum-pool records and 66,732 distinct wellbores, including 22,793 horizontal-classified bores. Mapped plan traces, documented depths, historical TD formations and vertical display assumptions have separate labels. Finer Mannville members without a matching regional depth surface remain on the map reference plane.
Choose a formation and your own contour interval and origin for top structure, lower-boundary structure or gross thickness. Compare published zero edges and unconformity evidence in 3D or supported WebXR. Source coverage boundaries remain visible as a separate evidence class.
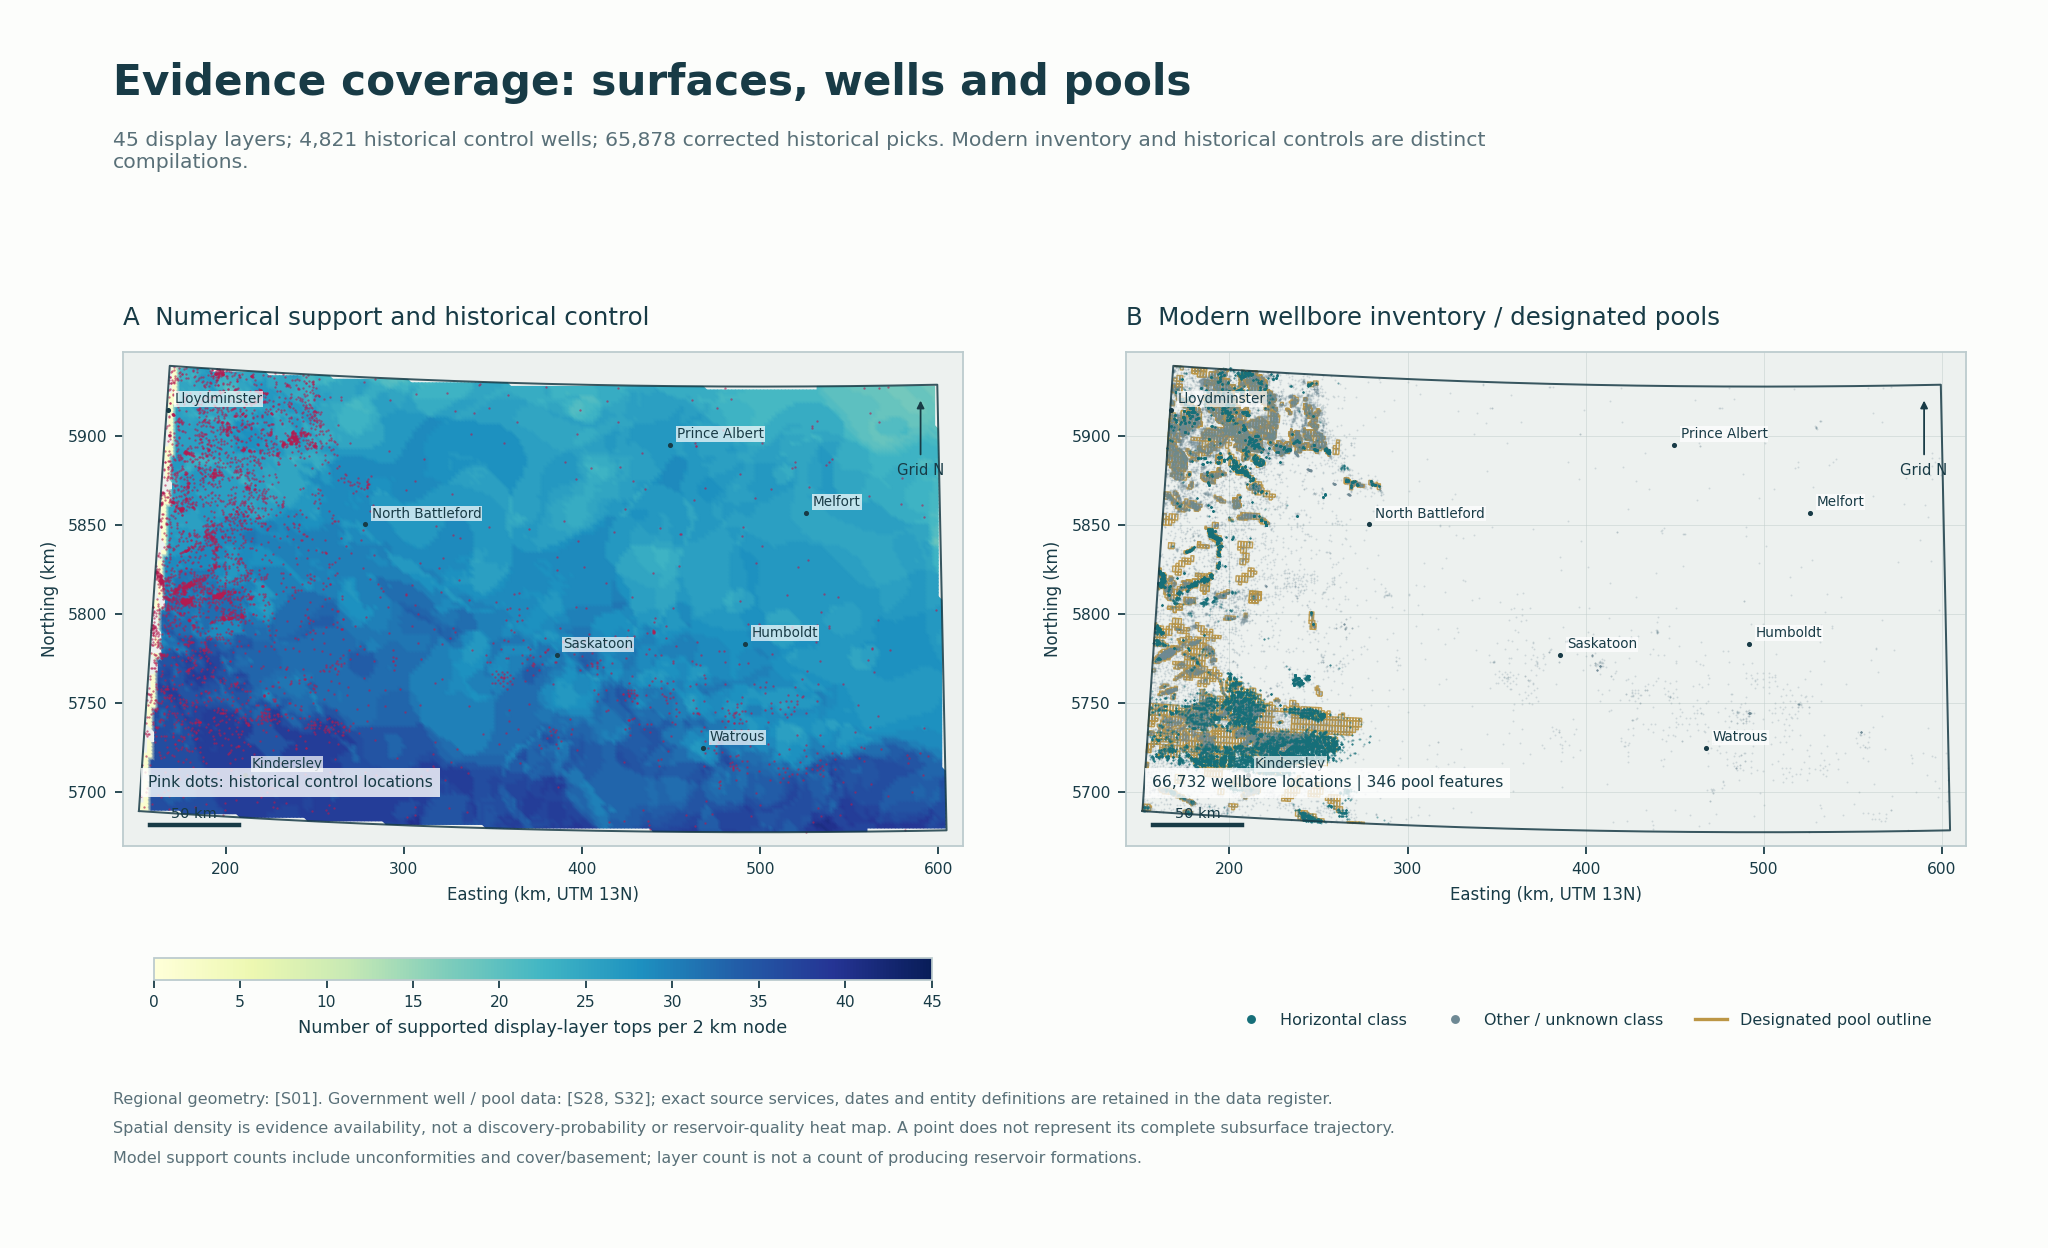 One continuous framework, two regional views.Follow supported formation geometry and independently attributed edge evidence. Finer reservoir architecture requires local correlation.
- Supported display layers
- 45
- Published pool records
- 346
- Distinct wellbores
- 66,732
- Horizontal-classified bores
- 22,793
West-central / central reports & portable study
SW Manitoba geology / hydrocarbon potential
Daly–Sinclair · Virden · Manson / Miniota · Waskada · Souris–Hartney
A separate Manitoba study combines regional geological surfaces, published well and pool records, historical production, and core and log evidence. Explore 53 formation, member and framework entries and 11 reservoir settings with the evidence, criteria and tests needed to investigate possible reservoirs around known pools.
The viewer contains 39 supported model layers: 37 published TGI surfaces, a bounded Lower Amaranth interpretation, and a separately identified sub-Mesozoic erosional surface reconstructed from 1,173 accepted historical controls. Geological chapters distinguish independently mapped horizons from finer subunits discussed in their regional context.
New: adjustable contours and erosional-surface evidence. Enter your own contour interval and origin, compare top/base structure with gross thickness, and carry the same linework into VR. Manitoba model-support limits, thinning indicators and modern bedrock contacts retain separate labels; none is promoted to a proven buried formation pinch-out.
Identify 200 published pool footprints. 182 have some supported placement on associated regional tops, including 29 with partial coverage; 18 remain entirely at the reference plane. Placements are approximate stratigraphic references, not measured reservoir boundaries.
Search 11,982 mapped licence / surface records, including 5,562 classified horizontal records, with their attached UWI and completion identifiers. Inspect available depth, formation-at-TD, production and physical-sample catalogue evidence. Wells without a documented depth retain their locations and available plan traces.
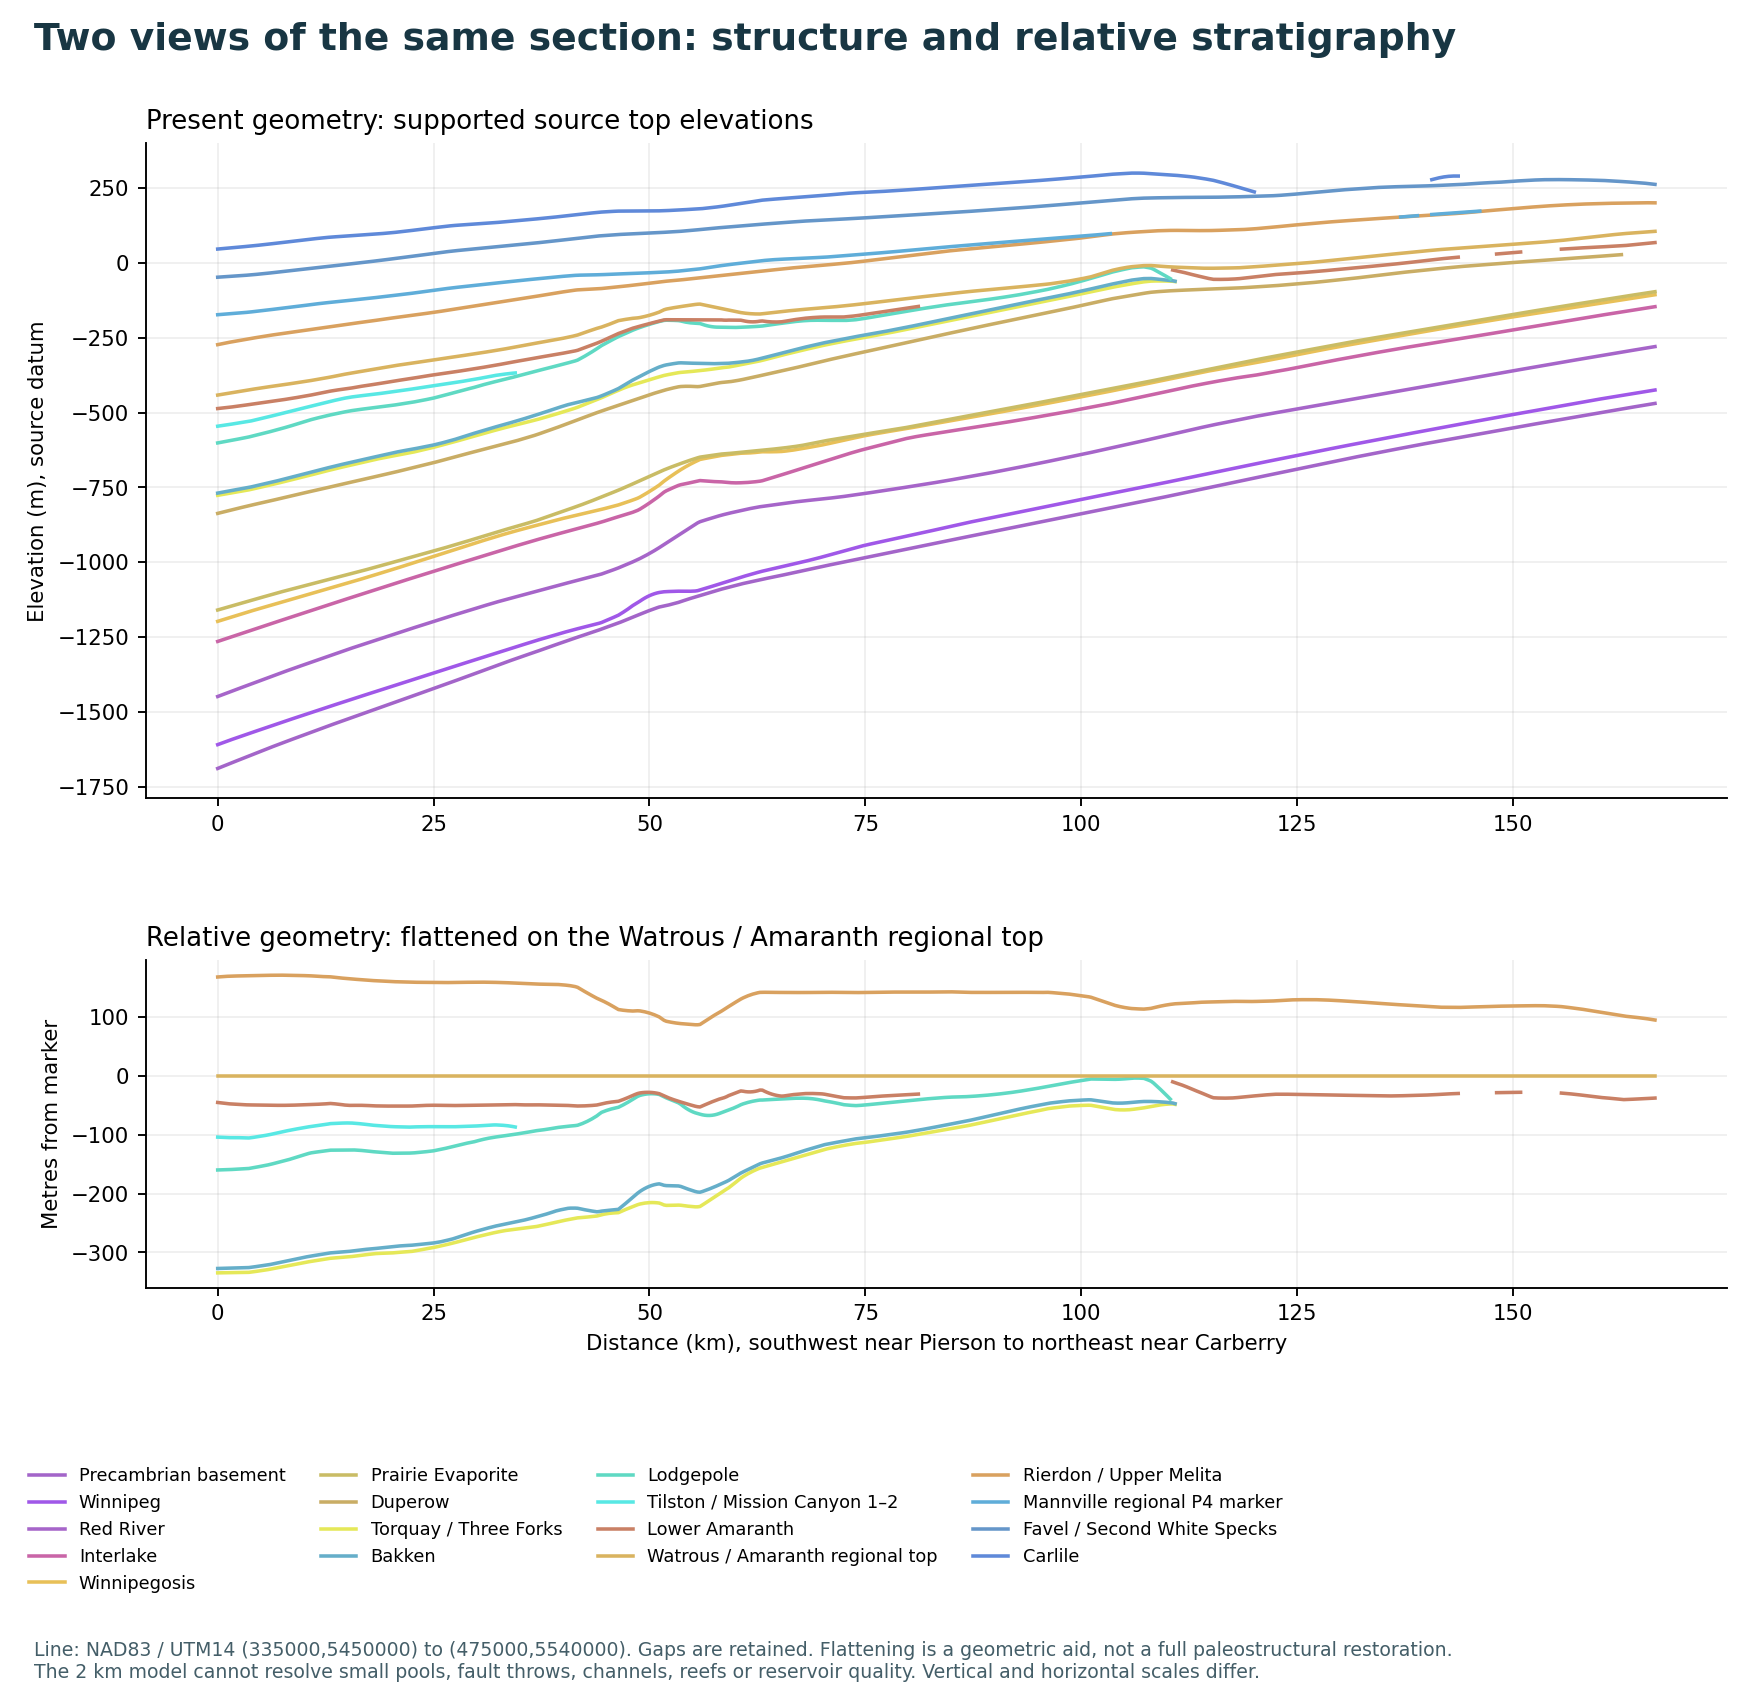 Southwest to northeast across Manitoba.Compare supported tops from near Pierson toward Carberry. The flattened section is a geometric comparison, not a complete paleostructural restoration.
- Supported model layers
- 39
- Mapped pool records
- 200
- Mapped licence records
- 11,982
- Horizontal-classified records
- 5,562
Manitoba reports & data
Contains information supplied by the Government of Manitoba and Manitoba Geological Survey and the Petroleum Branch. GeoNavigate’s interpretations and derived models are independent. Government endorsement is not implied.
SW Saskatchewan geology / hydrocarbon potential
Alberta border · Shaunavon · Swift Current · southwestern shallow-gas province
A separate regional build covers 110°W–106°W, 49°N–51.25°N. Explore 55 display layers, including seven unconformity surfaces, with formation and paleoenvironment chapters, 14 reservoir settings, and the evidence needed to investigate facies and trap continuity around existing pools.
The model retains 176 published pool records and 37,474 wellbores, including 5,943 horizontal-classified records. Source surfaces, mapped plan traces, reported depths and labelled vertical assumptions remain distinct. The initial drilled/in-progress filter contains 35,294 wellbores.
New edge and contour controls add 159 published zero-edge features and 194 attributed unconformity-contour features. Choose your own top, base or gross-thickness interval and origin; compare the linework in desktop 3D or a supported WebXR headset. Source-mesh boundaries retain their separate model-support classification.
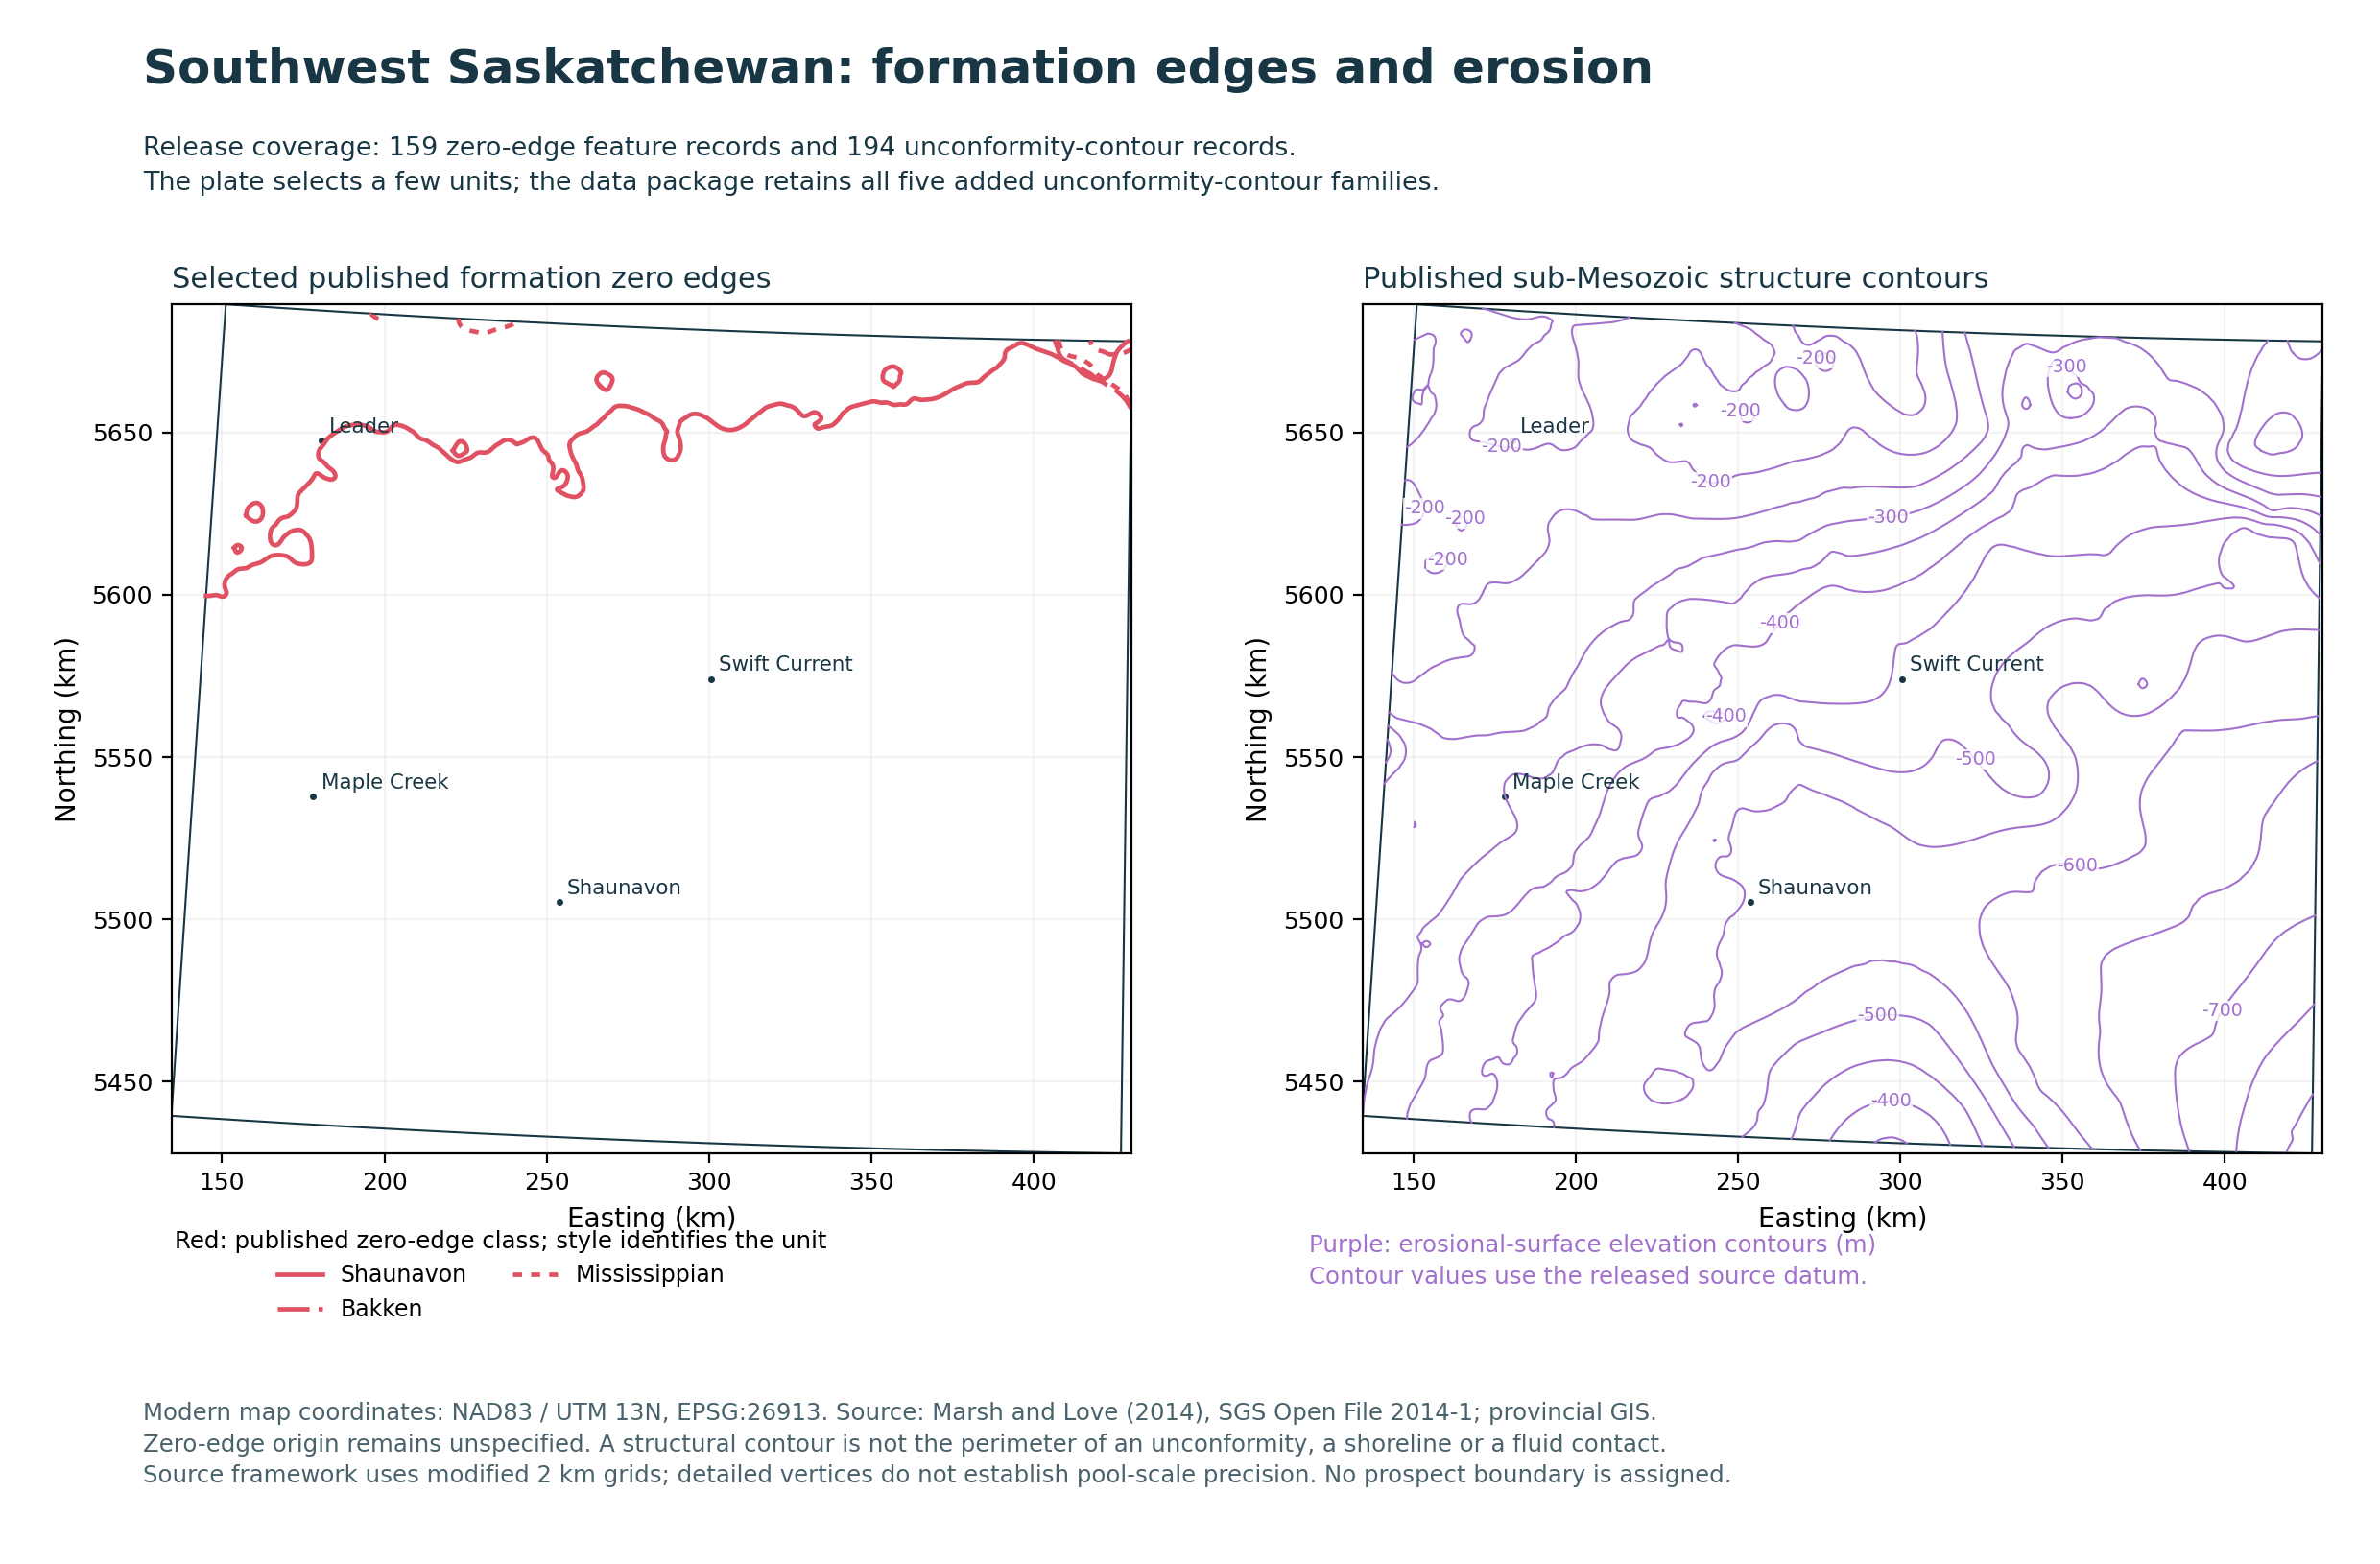 Published limits and erosional context.These regional lines locate evidence to investigate. They do not establish a connected reservoir, net pay or an exact paleoshoreline.
- Model display layers
- 55
- Unconformity surfaces
- 7
- Published pool records
- 176
- Inventory wellbores
- 37,474
SW Saskatchewan reports & portable study
Southeastern Saskatchewan
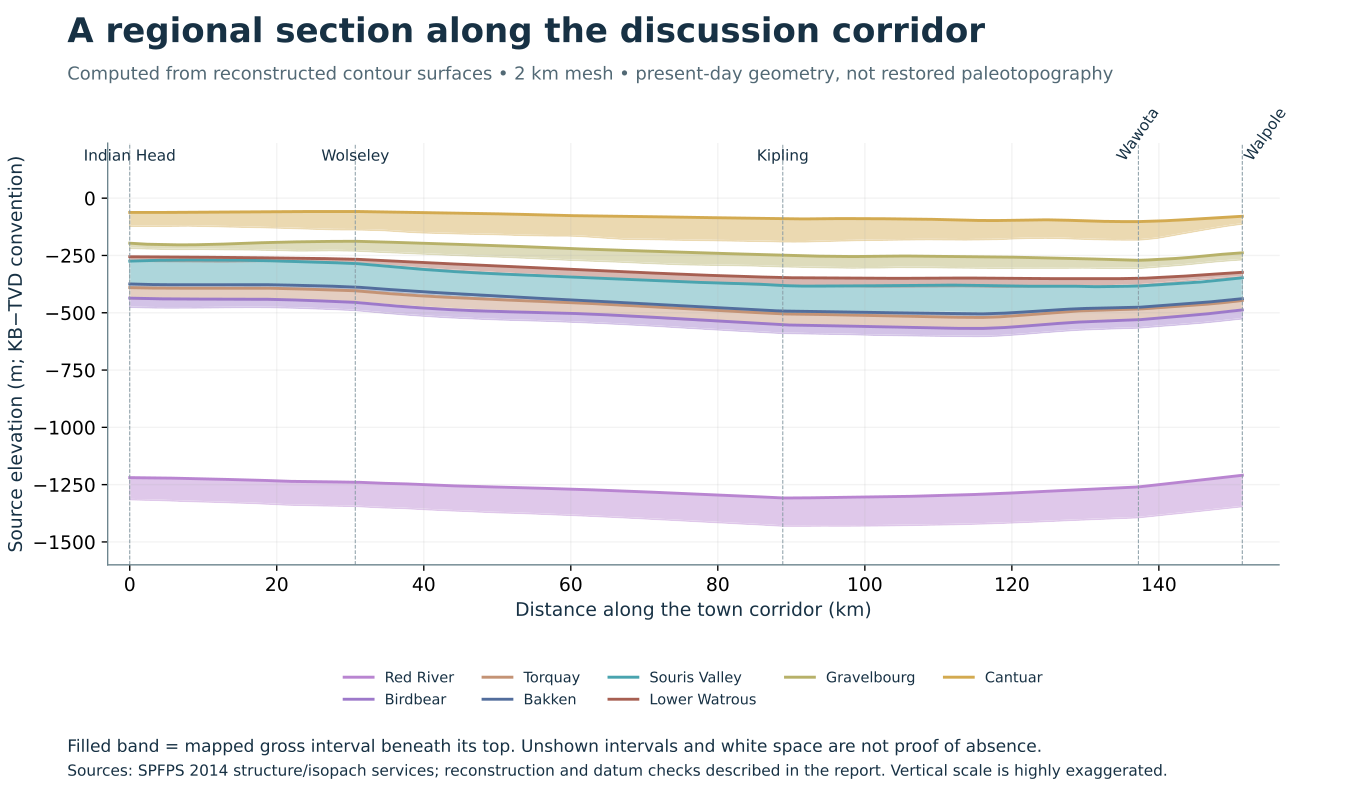
Walpole · Wawota · Wolseley · Indian Head
Explore how carbonate shelves, evaporitic flats, marine margins and valley systems shaped the regional stratigraphy. Follow the evidence from mapped formation edges and historical wells to depositional interpretations and possible hydrocarbon settings.
Explore 21 regional formation-top surfaces: the original 20 mapped intervals plus a separate Red Jacket top-only interpolation. Identify 266 official oil pools and place their footprints on the corresponding supported tops. Of these, 251 have some valid matching-top coverage, including 81 with partial coverage; 15 have none. Unsupported portions remain visible at the reference plane.
The viewer also includes 52,337 registered wellbores. It opens with 46,886 drilled wellbores, including 24,842 horizontal wellbores; the inventory filter adds licensed and planned records. Search, identify and focus wells, then toggle reported depth and formation-at-TD labels.
New: oil evidence and lone producers. Screen reported oil production from January 2022 through September 2026, find suspended or abandoned producers, inspect source-backed oil shows and core residue, and place formation/depth bubbles along wellbores. Set your own small-producer rate and same-formation spacing thresholds to identify wells for geological follow-up.
Formation zero edges and contour controls. Toggle 292 published zero-edge features and 243 attributed unconformity-contour features within the SE study. Adjust contour intervals, origins and quantities on supported model triangles. Published edges without matching depth support remain labelled map references.
The corridor is a geographic focus for investigating several separate, discontinuous play fairways. It is not an established continuous oil belt or a mapped ancient shoreline.
 A basin, layer by layer.Identify oil pools on their corresponding regional tops, inspect horizontal plan traces and compare wellbore depths.
- Regional top surfaces
- 21
- Mapped oil pools
- 266
- Inventory wellbores
- 52,337
- Formation maps
- 26
01 / ENVIRONMENTS THROUGH TIME
Depositional studies
Nine chapters connect observed rock, published core and log evidence, regional interpretation and testable reservoir possibilities. The complete study links to 46 primary references.
02 / FORMATION GEOMETRY
Formation edges & thickness maps
Browse six edge panels and twenty gross-thickness maps. Each image opens at full resolution, including its legend and source notes.
Loading the 26-map collection…
A mapped edge can reflect non-deposition, erosion or later modification. It is not automatically a reservoir pinch-out or a trap boundary.
03 / TAKE THE STUDY WITH YOU
Reports & data
Read the complete reports, work with the map and model data, or open the portable surfaces in a compatible 3D viewer.
Data packages & portable 3D models
Open the model as a full page, then select Enter VR when the browser supports it. Headset operation has not yet been physically tested. The model’s Sources & methods tab includes the controls and coordinate conventions.