
GEONAVIGATE / RESOURCES / MINERALOGY
Mineral identification: cleavage, fracture and optical properties
Describe mineral breakage, optical properties and feldspar intergrowths, with illustrated worked identification examples.
Compare calcite and aragonite: composition is not crystal structure.
Start with the broken surface
When describing a grain or specimen, separate its growth shape from its breakage. A flat exterior face may be a crystal growth face, a cleavage surface or an unrelated boundary. Inspect existing broken surfaces in several orientations before assigning a property. A rock chip may contain many minerals, so a flat chip face is not automatically evidence for cleavage within one mineral.
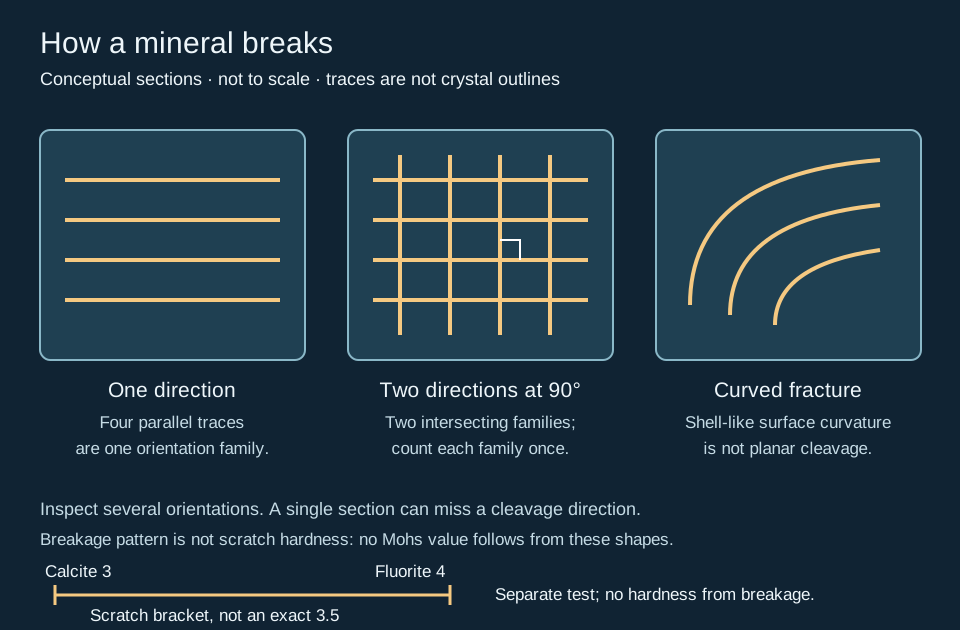
Count directions, not surfaces
Mineral cleavage follows preferred crystallographic planes. Several parallel steps belong to one direction. Two differently oriented families count as two directions. Record their angle and the quality of each family where visible. A photograph or section can hide another direction, and apparent trace angles depend on viewing orientation.
Worked observation: four lines are not four cleavages
In the left schematic, all four lines are parallel: the section shows one orientation family. In the middle panel, the horizontal and vertical families intersect at a drawn right angle. That section shows two directions at 90°. It does not prove that the complete three-dimensional specimen has only two directions. Rotate the sample and look for further consistent planes before recording the full cleavage count.
A useful description is “two visible planar breakage families, approximately perpendicular; additional directions not resolved.” This records what was seen without claiming a mineral identification from the diagram. In tiny drill cuttings, leave the property unassessed when breakage surfaces cannot be resolved.
Worked example: scratch resistance versus breakage
Imagine a single mineral grain that leaves a confirmed groove in calcite but is scratched by fluorite. Under suitable repeatable tests, its scratch resistance is bracketed by those references, Mohs 3 and 4; reporting exactly 3.5 would claim more precision than the observations support. The bracket beneath the breakage schematic represents this separate scratch test, not a measured midpoint. If the grain instead breaks into flakes, record that breakage separately and leave hardness unresolved until a genuine scratch comparison is obtained.
The National Park Service reference scale identifies calcite as 3 and fluorite as 4. The Mohs scale compares scratch resistance, not the force needed to crush a cutting. Check the tested material, surface and loose powder; mixed chips may contain different phases. This invented example does not identify a mineral or predict bit performance. Compare the streak test before interpreting a coloured mark. Original teaching example checked 28 October 2026.
Fracture and parting
Mineral fracture describes breaks away from cleavage planes. Conchoidal fracture has curved, shell-like surfaces, as commonly seen in quartz. Curvature is a texture observation, not a unique mineral test. Parting is planar separation associated with particular structural weaknesses, such as deformation or twinning; it may vary between specimens. A repeated planar break therefore needs context before being labelled cleavage.
A practical identification sequence
- Confirm whether you are observing one mineral grain or a mixed rock fragment. Note coatings, weathering and preparation.
- Describe growth form, visible breakage surfaces and any unresolved properties separately. Use the linked schematic as a counting aid.
- Compare independent properties: lustre, streak, relative scratch hardness and, where suitable, density or other diagnostic tests. Use fresh surfaces and established handling procedures.
- Retain alternatives when evidence conflicts. Record the observation and confidence alongside the proposed identification, then compare adjacent samples or obtain mineralogical analysis where the distinction matters.
For example, shell-like breakage in a pale grain is compatible with quartz, but colour and fracture alone are insufficient. Conversely, a cubic outline may reflect growth rather than cleavage. Drilling can produce fresh angular fragments; do not turn that observation directly into transport history or reservoir quality.
References and scope
Original teaching example and artwork, checked 24 October 2026. No private well samples or third-party figures are used.
- Tulane University: Physical Properties of Minerals — cleavage directions, parting and fracture.
- Oxford University Museum: Cleavage and fracture — specimen observations and shell-like breakage.
- Physical Geology, mineral properties — complementary identification properties.
Continue with the Geology Dictionary, wellsite glossary, or Chaser Geological wellsite services. Contact the team.
Bastite and mesh texture: reconstructing precursor grains
In altered ultramafic rocks, mineral identity and inherited geometry answer different questions. Bastite names a serpentine replacement texture, commonly after orthopyroxene. Mesh texture divides altered olivine domains into rim-bounded centres. Neither name is a complete mineral analysis. These are specific applications of pseudomorphic preservation.
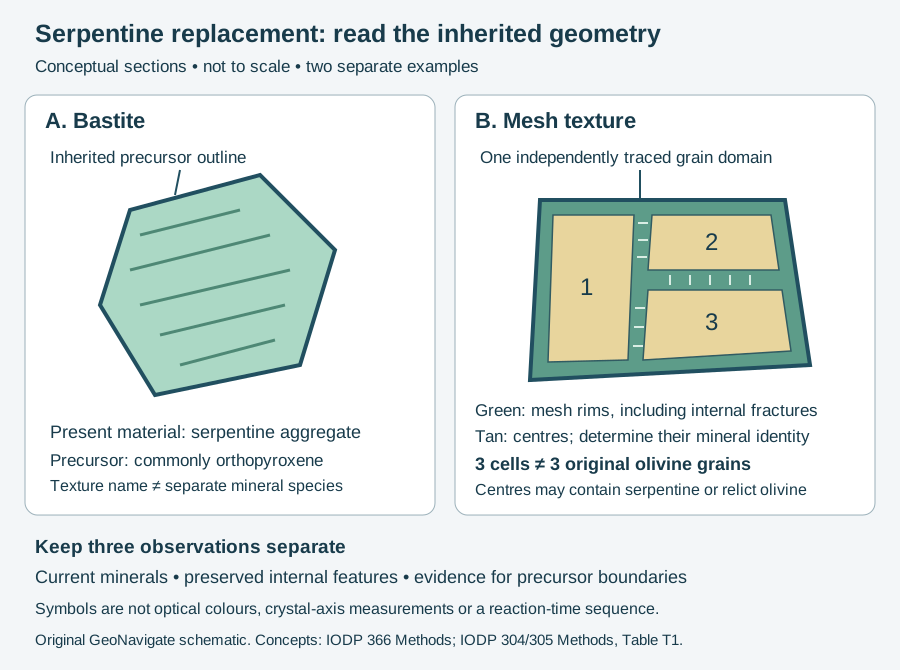
Worked identification: three cells, one grain?
Imagine an independently traced original olivine domain containing two internal fractures. Alteration around those fractures and its perimeter produces three enclosed mesh cells, as in the right panel. Counting three centres gives a cell count of three. The stipulated precursor grain count remains one. The internal boundaries subdivide a grain; they do not create evidence for three original grains.
Now remove the independent boundary evidence from that same hypothetical observation. Three centres remain visible, but the original grain count is unresolved. Record “three mesh cells in the examined field; precursor boundaries uncertain.” Do not use their widths as a reconstructed igneous grain-size distribution. This exercise changes the available evidence, not the alteration process.
For the left panel, suppose analysis identifies serpentine inside an outline attributed to pyroxene. A bastite interpretation requires evidence for that precursor. The outline alone cannot distinguish replacement from an unaltered grain or a misleading section. Report the current phase identification, preserved features and basis of the precursor interpretation in separate notes.
Apply the distinction to real descriptions
The IODP Site U1492 report documents mesh and bastite textures in strongly serpentinized rocks, together with examples where later recrystallization obscures earlier textures. It illustrates why present mineral proportions and inferred original proportions belong in separate records. A surviving texture does not mean its original mineral survives.
In core or cuttings descriptions, retain sample identity and the observation method. A detached chip may truncate the relationships needed for reconstruction. The cartoon supplies no temperature, reaction rate, permeability or serpentine-species determination. Compare mineral replacement and the oilfield bastite entry; continue to the wellsite geology workflow or contact Chaser Geological.
Sources and scope
Checked 31 October 2026: IODP Expedition 366 Methods, serpentinite textures; IODP 304/305 Methods, Table T1; IODP Site U1492, serpentinized ultramafic rocks. The three-cell exercise and artwork are original, hypothetical teaching material; no private samples or external expert-review claim.
Crystal zoning: endpoints can hide internal variation
Compositional zoning describes chemical differences within a crystal. For plagioclase, a core-to-rim decrease in anorthite component is termed normal zoning; an increase is reverse zoning. Oscillatory zoning adds repeated reversals. An overall trend and internal oscillations are compatible descriptions.
Worked comparison: three invented traverses
Assume five analyses in each of three hypothetical plagioclase crystals. For this ideal albite–anorthite exercise, An = 100 × Ca/(Ca + Na), using atomic proportions; potassium and other components are neglected. An70 therefore means 70 mole percent anorthite component in the binary model, not 70 percent calcium by mass. Each traverse runs from a stipulated core at normalized position 0 to a rim at 1. These positions have no physical length or time units.
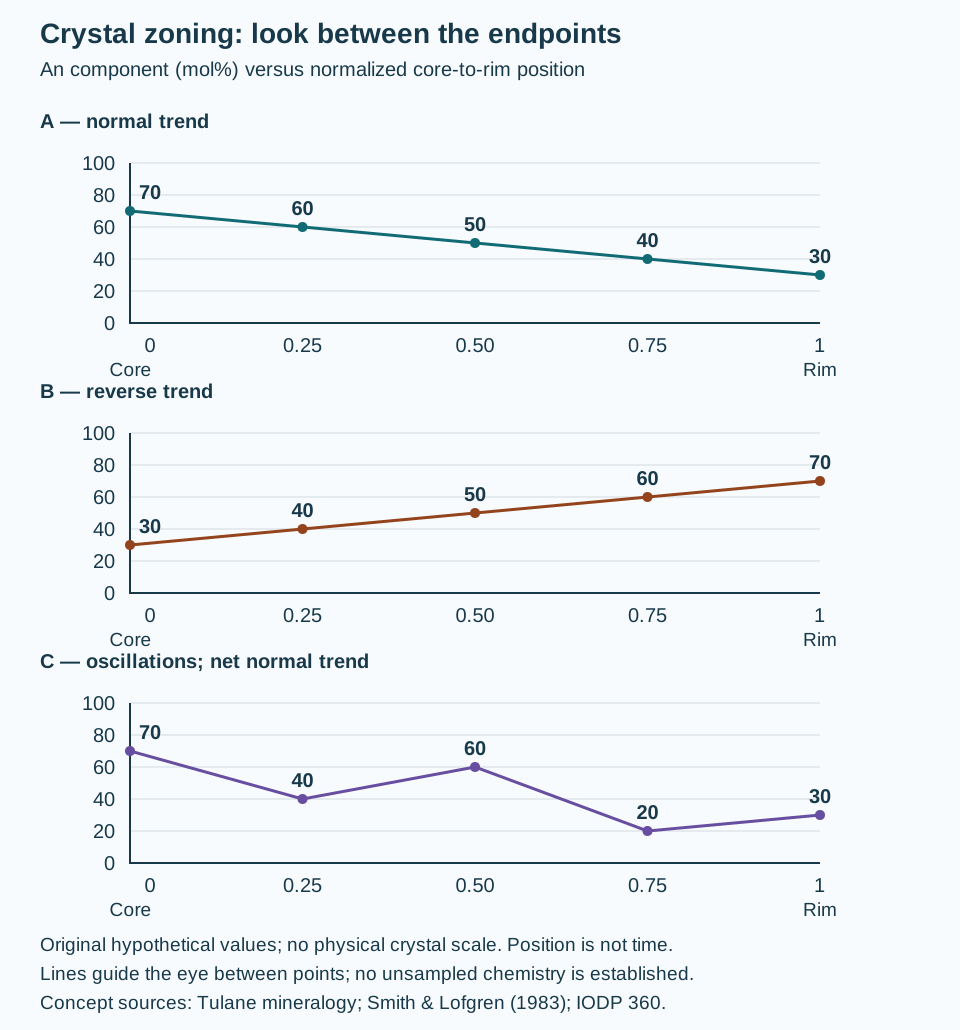
| Position | A | B | C |
|---|---|---|---|
| 0 (core) | 70 | 30 | 70 |
| 0.25 | 60 | 40 | 40 |
| 0.50 | 50 | 50 | 60 |
| 0.75 | 40 | 60 | 20 |
| 1 (rim) | 30 | 70 | 30 |
A decreases at every sampled step. B increases at every step. C changes by −30, +20, −40 and +10 percentage points: it reverses direction repeatedly, while its rim still lies 40 points below its core. A and C consequently have the same endpoint difference, −40, despite very different internal patterns. Two endpoint analyses would fail to distinguish them. The measured values in a real traverse must be evaluated against analytical uncertainty and sampling resolution before treating small differences as meaningful zones.
Describe the evidence before assigning a history
IODP Expedition 360 recorded both the prevalence of plagioclase zoning and its pattern, including continuous, discontinuous, patchy and oscillatory types. That approach keeps abundance and geometry distinct. A change in optical appearance can motivate a traverse, but the appearance alone does not supply the An values assumed here.
Twin bands concern crystal orientation; compositional zones concern chemistry. They may coexist. Exsolution concerns separation into distinct phases and should also be evaluated independently. Do not label every visible stripe a compositional zone.
Smith and Lofgren compared natural and experimentally grown plagioclase and discussed both bulk-magma changes and local growth effects. Accordingly, the plotted pattern alone does not identify a magma recharge event, cooling rate or elapsed time. A geological interpretation needs petrographic relationships and appropriate chemical evidence beyond this exercise. For loose cuttings, retain the sample interval and grain identity; an incomplete fragment may not expose the original core and rim.
Sources and further use
Terminology checked 31 October 2026: Nelson, Tulane University: plagioclase; Smith and Lofgren (1983), NASA record and abstract; IODP Expedition 360 methods, mineralogy. Original numbers, explanation and artwork; no copied figures, private samples or claimed external expert review. Continue to plagioclase charge balance, wellsite terminology, Chaser Geological services or contact Chaser.
Worked description: enclosure is different from grain-size contrast
Record crystal size, mineral identity and grain relationships separately. Poikilitic texture describes smaller crystals enclosed by a larger host. Ophitic specifies the plagioclase–pyroxene relationship; subophitic describes partial enclosure in the convention used here. The IODP Expedition 402 methods provide this explicit distinction.
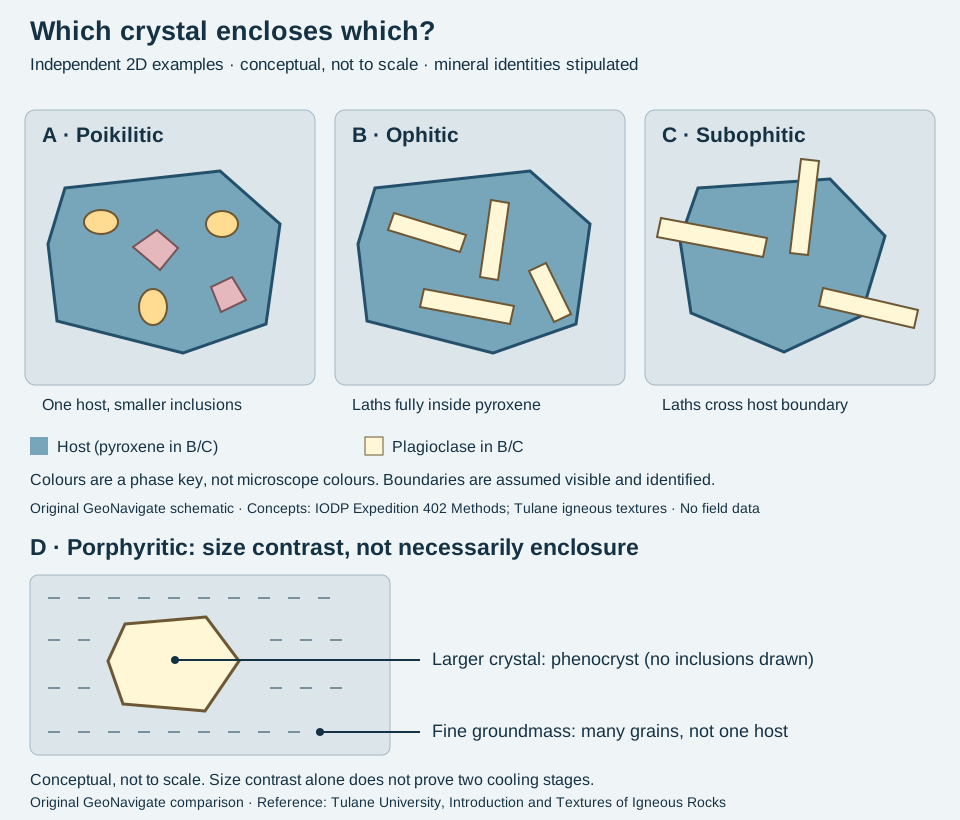
Three invented observations
- Section A: mineral identification and optical continuity establish one large host containing several smaller crystals of other minerals. Describe the relationship as poikilitic. A large coloured patch alone would not establish that it is one crystal.
- Section B: several identified plagioclase laths have complete outlines inside a continuous clinopyroxene host in the examined section. This supports an ophitic description. Record the mineral identities as well as the texture.
- Section C: plagioclase laths extend across the boundary of the identified pyroxene, which only partly encloses them. Describe this observed relationship as subophitic. Do not infer that C must evolve into B.
A practical record that keeps uncertainty visible
An example note could read: “Mafic igneous rock; plagioclase laths enclosed by optically continuous clinopyroxene in the examined thin section; ophitic relationship locally present; alteration obscures some boundaries.” This is an invented description, not a report from a well. It does not assign modal percentages or demonstrate that the whole rock shares the same texture.
For a loose chip, distinguish its broken edge from an original grain boundary. If the host or inclusions cannot be identified, retain a descriptive phrase such as “small pale laths within a larger dark domain” and record the unresolved alternatives. Additional views, thin-section work or mineral analysis may be needed; a colour photograph alone cannot confirm optical continuity.
Porphyritic texture concerns larger crystals in a finer groundmass; it does not by itself say that one crystal encloses the others. Describe both relationships where supported. Neither size contrast nor enclosure alone supplies a unique cooling history. For wellsite work, preserve sample depth, preparation and possible cavings before using an igneous chip to locate a contact.
References checked 30 October 2026: IODP Expedition 402 Methods, igneous petrology; Stephen Nelson, Tulane University, igneous textures and structures. Original observations and artwork; no source photograph, private well data or expert review claimed. Compare oilfield terminology and Chaser Geological wellsite services.
Worked comparison: two independent observations
Imagine two identified igneous specimens. In specimen D, a conspicuous crystal sits in fine groundmass but has no visible inclusions: record porphyritic texture, without assigning poikilitic texture. In specimen A, one continuous crystal encloses smaller grains, but its size relative to the rest of the rock is unknown: record poikilitic texture and leave the porphyritic question open. These are invented observations, not measured samples.
The lower panel makes the first distinction visible. The short groundmass marks represent many grains, not a single enclosing crystal. Read the upper and lower panels as independent examples, not a sequence. For the phenocryst, record dimensions and mineral identity when actually measured; neither is supplied by this sketch.
Cooling-history limit: the Tulane reference explicitly allows porphyritic texture to form during a single cooling stage as well as through changing cooling conditions. A two-stage cooling explanation is a possible interpretation, not a consequence forced by grain-size contrast. Keep the observed texture separate from that interpretation.
Plagioclase: changing two ions preserves charge
The plagioclase series links ideal albite, NaAlSi₃O₈, with anorthite, CaAl₂Si₂O₈. Substituting calcium for sodium alone adds positive charge. Coupling it to aluminium for silicon removes the same amount: Na⁺ + Si⁴⁺ and Ca²⁺ + Al³⁺ each total +5. This is chemical accounting, not a drawing of an atomic exchange pathway.
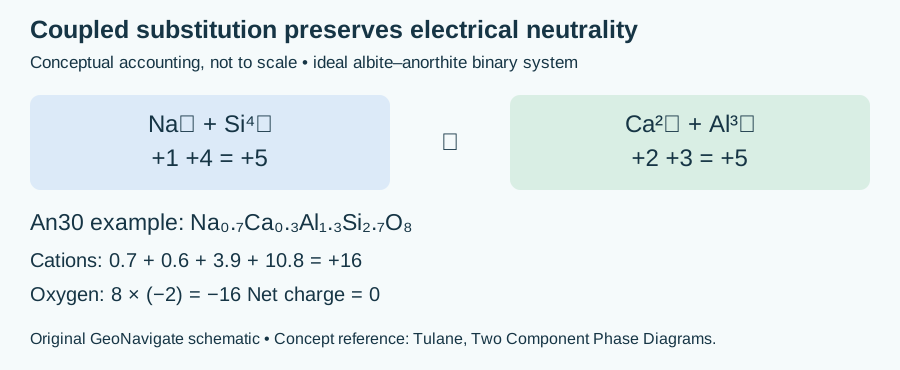
Worked example: An30 is a component proportion
Take 0.70 mole fraction albite component and 0.30 anorthite component. Weighting their formulas gives Na₀.₇Ca₀.₃Al₁.₃Si₂.₇O₈. The positive charge is 0.7×1 + 0.3×2 + 1.3×3 + 2.7×4 = 16; eight O²⁻ contribute −16. Na + Ca totals one and Al + Si totals four per formula unit. Fractional subscripts describe average composition, not fractions of individual atoms.
This calculation assumes the ideal binary system. An30 is not calcium mass percent, grain-volume percent or the fraction of separate anorthite crystals. It cannot be assigned from colour or a cuttings photograph alone. Retain identification confidence and analytical basis in the sample description; chemical composition and twinning describe different attributes.
Concept source, read 30 October 2026: Stephen A. Nelson, Tulane University: binary phase diagrams and coupled solid solution. Arithmetic and artwork are original teaching examples. See feldspar in the Oilfield Glossary and Chaser Geological wellsite services.
Pyroxene: observation, composition and naming
Pyroxene is a group, not a single chemical composition. Diopside and hedenbergite illustrate two ideal calcic clinopyroxene end members. Near-right-angle cleavage can help distinguish the group from amphibole in a suitable section, but one view may hide a cleavage direction.
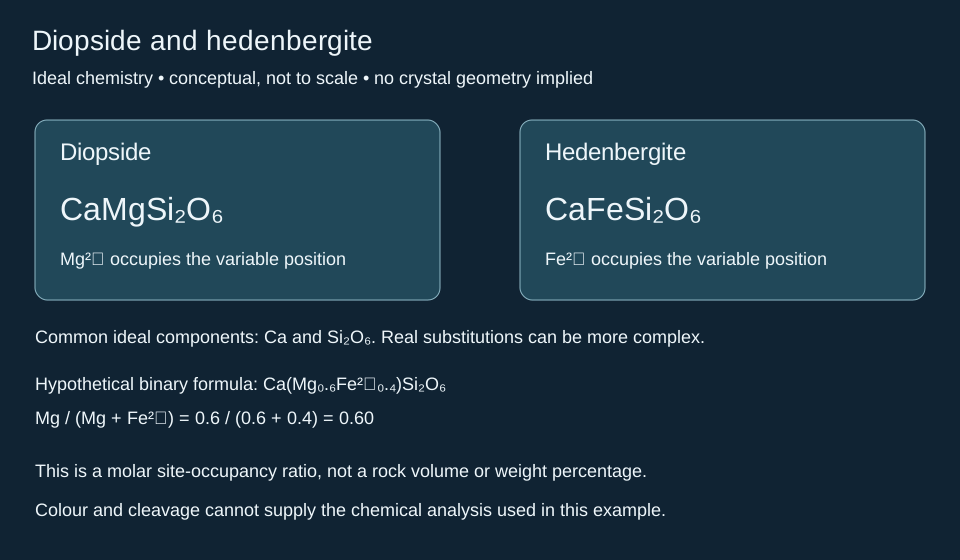
Worked example: state the denominator
Assume an ideal binary formula Ca(Mg0.6Fe2+0.4)Si2O6. The magnesium fraction of the Mg-plus-ferrous-iron position is 0.6/(0.6+0.4) = 0.60. This does not mean that a rock contains 60% diopside by volume, or 60% magnesium by mass. It is a stipulated atomic occupancy ratio. Natural pyroxenes may include other components, so this calculation alone is not a complete mineral classification.
In cuttings, record a tentative group identification separately from a confirmed species. A photograph or cleavage observation does not provide the chemistry assumed here. Retain the sample interval, analytical method and unresolved alternatives before making a provenance interpretation. Compare the wellsite glossary entry.
References: University of North Dakota: calcic clinopyroxene; University of Waterloo: pyroxenes. Original hypothetical calculation, checked 29 October 2026.
Density and specific gravity: keep the denominator visible
Density is mass divided by volume. Specific gravity compares density with a reference; mineral descriptions commonly use water. The ratio has no units. A density value in kg/m³ cannot be copied directly into a specific-gravity field.
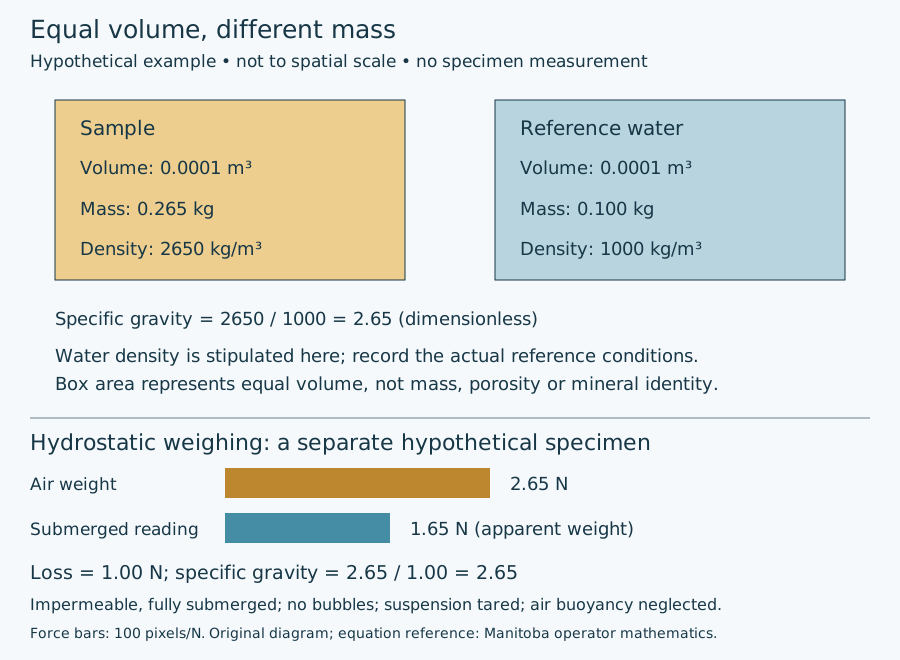
Worked example: compare equal volumes
Suppose a sample has mass 0.265 kg and volume 0.0001 m³. Its density is 0.265 / 0.0001 = 2650 kg/m³. For this exercise stipulate reference water density of 1000 kg/m³. Equal-volume water has mass 0.100 kg, and the density ratio is 2650 / 1000 = 2.65. This reference is an explicit approximation, not a claim that water has exactly that density at every temperature and pressure.
Change specimen size without changing material
A second piece of the same uniform material has twice the volume and twice the mass: 0.0002 m³ and 0.530 kg. Its density remains 2650 kg/m³ and its specific gravity remains 2.65 on the same reference. Calling it “twice as dense” because it is twice as heavy would confuse an extensive quantity with a ratio. Conversely, comparing masses becomes informative only after the volume basis is controlled.
The arithmetic does not identify a mineral. A rock aggregate, a mineral grain and a container of loose cuttings have different volume boundaries; spaces between chips are not automatically pore space within the rock. Record the specimen, preparation, moisture condition and measurement method with any reported density. Keep unresolved volume or reference conditions visible rather than converting an impression of heft into a precise number.
References checked 29 October 2026: SLB density and specific gravity; Tulane University mineral properties. Original hypothetical example; no private data or reproduced figure. Compare oilfield terminology, porosity measurement bases and Chaser Geological services.
Tenacity: a bent flake is not a hardness test
Tenacity describes breakage or deformation behaviour. In mineral-identification terminology, an elastic specimen recovers after bending; a flexible specimen remains bent. These descriptive categories do not provide a numerical stiffness. Scratch hardness and cleavage need their own observations.
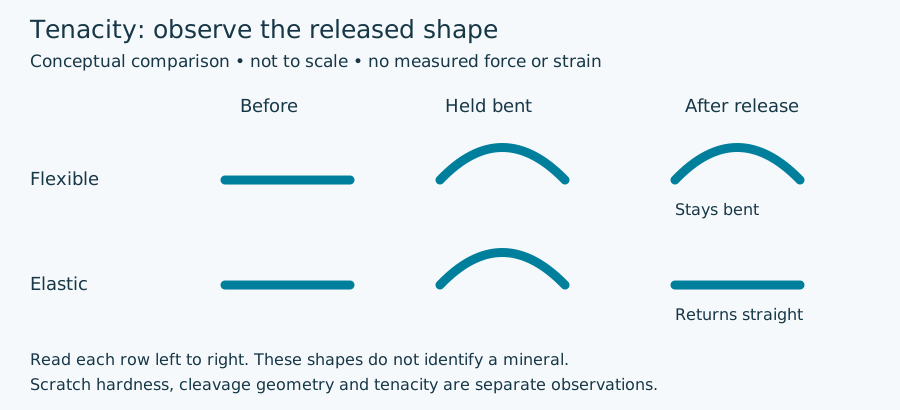
Worked observation: wait for the released state
Imagine two already-documented specimen observations. A thin flake A bends and remains curved when released. Flake B bends and returns to its original shape. The observations support flexible and elastic behaviour respectively. If the record contains only the held-bent photograph, it cannot distinguish those outcomes. Retain before-and-after evidence rather than assigning the label from one curved silhouette.
Now suppose specimen C breaks into fragments instead. Record the breakage and inspect the resulting surfaces separately. Repeated planar surfaces concern cleavage; a curved surface concerns fracture texture. Neither observation gives C a Mohs hardness value. In a multi-mineral rock chip, separation between grains may also differ from breakage within a crystal.
What this means for sample descriptions
Record sample identity, preparation and whether the observation concerns an individual grain, a flake or an aggregate. A loose cuttings fragment cannot establish the behaviour of an intact formation under in-situ stress. Do not convert “brittle” or “elastic” from an identification description into a drilling-strength or stimulation index. If recovery or handling has already damaged a specimen, retain that limitation instead of inventing its original response. These invented observations are a reasoning exercise, not instructions to damage reference specimens.
References checked 29 October 2026: MSA Mineral ID Key, Tenacity and Stephen Nelson, Tulane University, Physical Properties of Minerals. Original explanation and artwork; no private sample or external expert review claimed. Compare wellsite terminology, scratch hardness and Chaser Geological services.
Streak powder or scratched plate?
Streak describes mineral powder colour; lustre describes reflected light from a surface. Keep both separate from the intact grain colour. The Mineralogical Society of America explains that a typical porcelain plate is about Mohs 6.5: a harder mineral can scratch it rather than supply a useful streak. The precise test material matters.
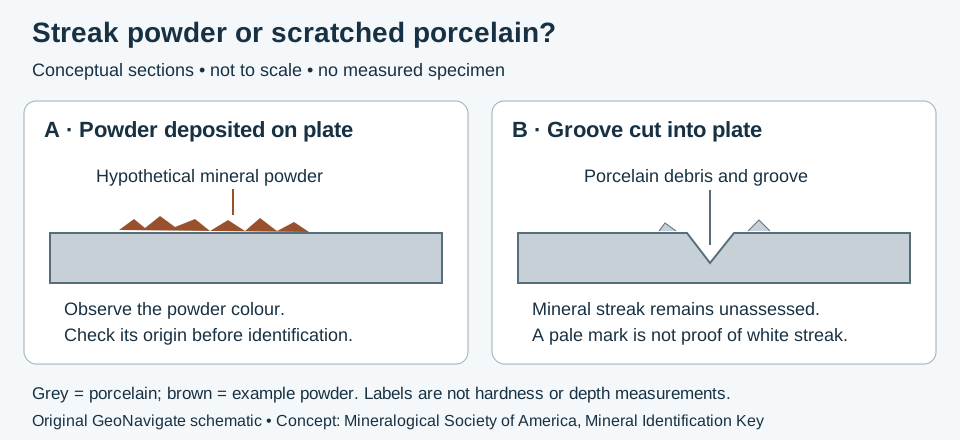
Worked example: three observations, three records
- A: brown powder on the test surface. Record the observed powder colour. Confirm it came from the tested grain rather than a coating or earlier residue; the colour alone is not a mineral identification.
- B: a groove with pale debris. Record a scratched plate and leave mineral streak unassessed. Do not automatically enter “white streak.” Compare independent scratch-hardness observations and the test material.
- C: no interpretable trace from a tiny chip. Record “streak not resolved.” This is missing evidence, not evidence that the mineral has no streak colour.
Use the result in a cuttings description
These are invented observations. If a chip contains several minerals, the trace may combine materials; do not assign a single phase from its colour. Retain the chip identifier, tested surface, preparation and uncertainty with the photograph. Compare scratch hardness and cleavage before proposing an identity. A photograph of intact cuttings cannot substitute for an observed powder test.
For an invented tray of 12 selected chips, 8 yield interpretable mineral powder, 2 scratch the plate and 2 are unresolved. Only 8/12 (about 67%) yielded an interpretable result. The four remaining chips are not white-streak identifications; this fraction is neither a mineral abundance nor identification confidence.
Original teaching exercise checked 28 October 2026. Definitions also checked against National Park Service mineral properties. No private samples or external expert review claimed. Compare the Oilfield Glossary and streak-plate entry. For geological support see Chaser services or contact GeoNavigate.
Optical mineral identification: keep microscope modes separate
Broken surfaces help describe a specimen, but a petrographic microscope adds independent evidence. In plane-polarized light (PPL), record absorption colour, pleochroism, relief and visible cleavage. With crossed polarizers (XPL), inspect interference colours and extinction. Keep the illumination and analyser setting in the description so another observer can reproduce the observation.
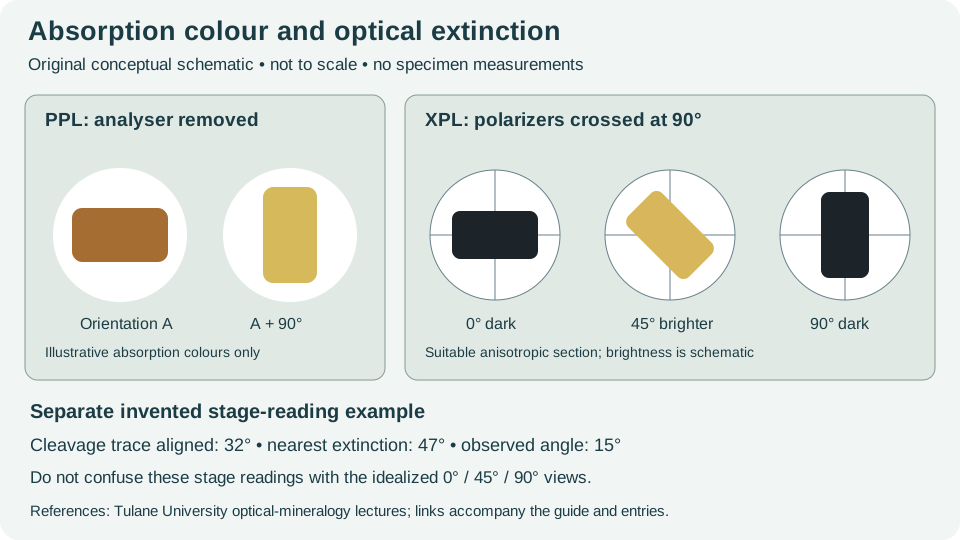
Worked stage-reading example
For an invented transparent grain, align a clearly identified cleavage trace with a microscope crosshair and record a stage reading of 32°. Insert the analyser and rotate to the nearest extinction position at 47°. The observed acute extinction angle is |47° − 32°| = 15°. Record the reference trace, rotation sense and grain orientation. A table may give a maximum angle for a particular section; this one-grain measurement is not automatically that maximum, and does not uniquely identify a mineral.
For a suitable anisotropic section, the dark positions recur every 90° as the stage rotates. A section viewed along an optic axis can remain dark; opaque grains and setup problems can also appear dark. Check transparency in PPL, rotate multiple grains and verify the crossed polarizers before classifying persistent darkness.
Birefringence needs thickness and orientation
Birefringence and interference colour concern a different observation from absorption colour. Retardation is section thickness multiplied by the effective refractive-index difference for that orientation. For a hypothetical 30 µm section and effective difference 0.010, retardation is 0.30 µm = 300 nm. Neither thickness nor the effective index difference was measured in this exercise. A colour alone cannot determine both unknowns.
- Describe PPL colour changes before inserting the analyser. A single grain may not expose every principal absorption colour.
- Use XPL to document extinction behaviour and a named reference direction; retain anomalous or uneven extinction rather than forcing a clean angle.
- Combine optical observations with cleavage, composition and texture. Grain mounts and thin sections require preparation; loose wellsite cuttings viewed under a hand lens do not reproduce these measurements.
Sources checked 26 October 2026: Tulane University, Stephen A. Nelson, Biaxial Minerals and Interference of Light. Original examples and artwork; no specimen data or expert review claimed. Browse the wellsite terminology or contact Chaser Geological.
Feldspar twinning: describe the pattern before naming the grain
Crystal twins are differently oriented domains within an intergrowth. Under crossed polarizers, neighbouring domains can change brightness differently as the stage turns. Keep this observation distinct from a crack, cleavage trace or colour band seen in ordinary light.
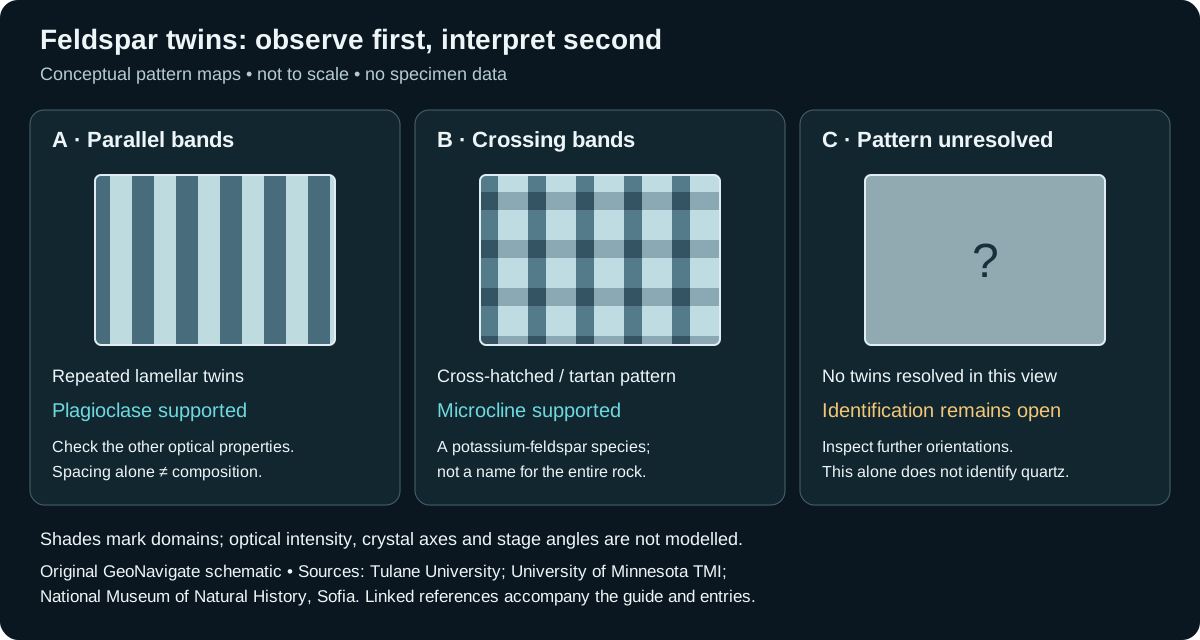
Worked observation exercise: three grains, three defensible records
Imagine a prepared thin section containing three pale grains. The following observations are invented; the illustration is a recording aid, not a specimen photograph.
- Grain A: repeated parallel bands respond differently during XPL rotation. Record “parallel twin bands; plagioclase interpretation supported by the remaining optical properties.” Polysynthetic twinning is useful evidence, but band spacing alone is not a chemical analysis.
- Grain B: two intersecting band families make a cross-hatched pattern. Record “tartan twinning; microcline interpretation supported.” This refines the broader potassium-feldspar description; it does not name the whole rock.
- Grain C: no twins are resolved in the initial view. Record “twinning not resolved; mineral identification open.” Check another orientation and combine cleavage, relief and other optical properties. Absence of this one feature does not establish quartz.
What the exercise cannot tell you
Do not turn these three selected observations into a modal percentage: they are neither a representative point count nor measured grain areas. Do not infer a unique cooling or deformation history from a pattern alone. A reliable report keeps the specimen identifier, preparation, illumination, observations and interpretation together so that the conclusion can be revisited.
For composition estimates from extinction angles, use an established method with its required section orientation and calibration. The earlier invented 15° example demonstrates subtraction only; it is not a plagioclase composition determination. A hand-lens description of loose cuttings does not reproduce thin-section microscopy.
Sources and related terminology
Sources checked 27 October 2026: University of Minnesota Tool for Microscopic Identification: Feldspar; National Museum of Natural History, Sofia, Microcline; Tulane University, Stephen A. Nelson, Twinning and Biaxial Minerals. No expert review, measured sample or third-party artwork is claimed. Continue with wellsite sample terminology or Chaser Geological services.
Worked identification: an inherited shape is not a mineral test
Pseudomorph describes a mismatch between present mineral identity and inherited form. Smithsonian examples use the naming order “product after precursor.” Mineral replacement is the broader process; not every replacement preserves a recognizable outline. In fluid-mediated cases, dissolution and precipitation can occur together near a moving reaction interface. This differs from imagining that every specimen changes through simple atom-for-atom substitution.
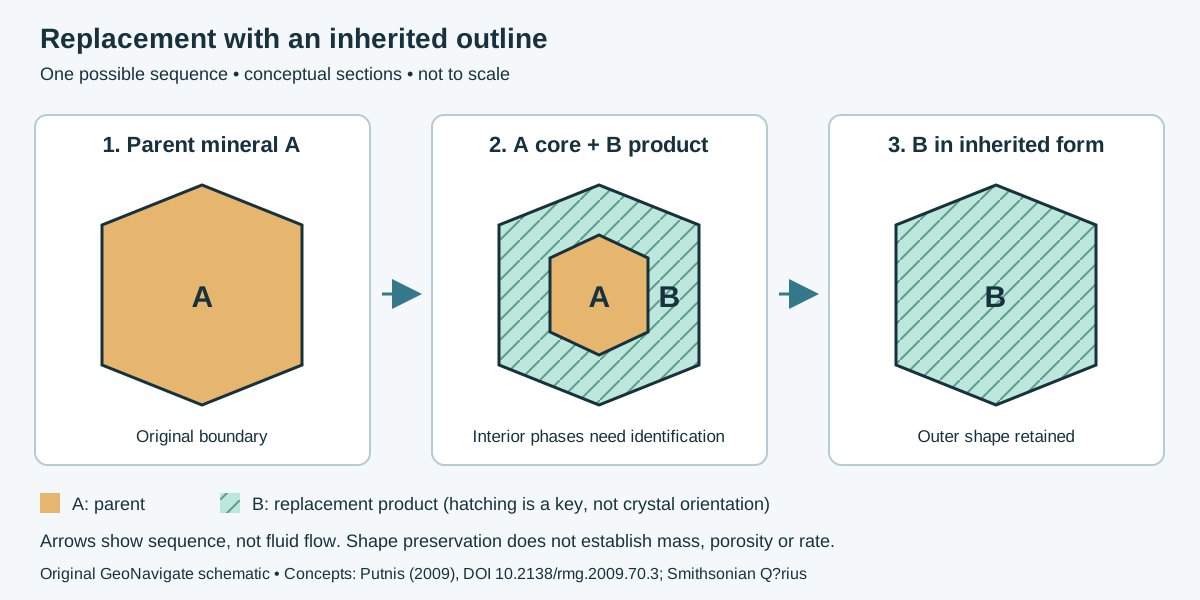
Three hypothetical specimens
| Observation | What to record | What remains unresolved |
|---|---|---|
| A: a well-shaped object; no mineral analysis. | Describe its faces and outline. Present mineral identity is unconfirmed. | Shape alone cannot demonstrate either an original crystal or a pseudomorph. |
| B: analysis distinguishes an A core and B rim inside the inherited outline. | Map both phases and their contact. Partial replacement is a candidate interpretation. | Test replacement against overgrowth or coating using interior textures and additional sections. |
| C: only B is detected in the examined section, with an outline attributed to A. | Report a candidate B-after-A pseudomorph and explain the basis for identifying A. | A remnant outside the section or below detection remains possible; “none detected” is not “none exists.” |
Separate observation, mechanism and reservoir inference
For specimen B, draw the external boundary first, then mark the analysed locations without extrapolating a single spot across the specimen. Give the identification method and its spatial resolution. If a proposed A core is merely a colour contrast, retain a descriptive colour boundary until mineral identity is checked. These are reasoning steps for this invented exercise, not a laboratory sampling standard.
Xia and colleagues' pentlandite–violarite study shows that reaction conditions can influence how finely parent features are preserved. A hand-specimen silhouette cannot recover that kinetic history. Putnis also explains why retaining an outer volume need not mean retaining solid mass: transfer of dissolved components and development of pore space must be considered. No permeability value follows from this cartoon. Compare dolomitization and diagenesis in their own rock context.
For cuttings, record the texture actually preserved within a chip. Avoid reconstructing a former grain boundary from the arrangement of loose fragments. See the oilfield replacement entry and wellsite geology workflow. Contact Chaser Geological.
References and scope
Checked 27 October 2026. Putnis (2009), Mineral Replacement Reactions, pp. 87–124 (relevant introductory and pseudomorphism sections); Smithsonian, Pseudomorphic Minerals; Xia et al. (2009), institutional abstract and bibliographic record, DOI. The latter supports a mechanism example, not a claimed full-paper review. No publication artwork, private specimens or expert-review claim are used.
Feldspar intergrowths: composition, twins and texture
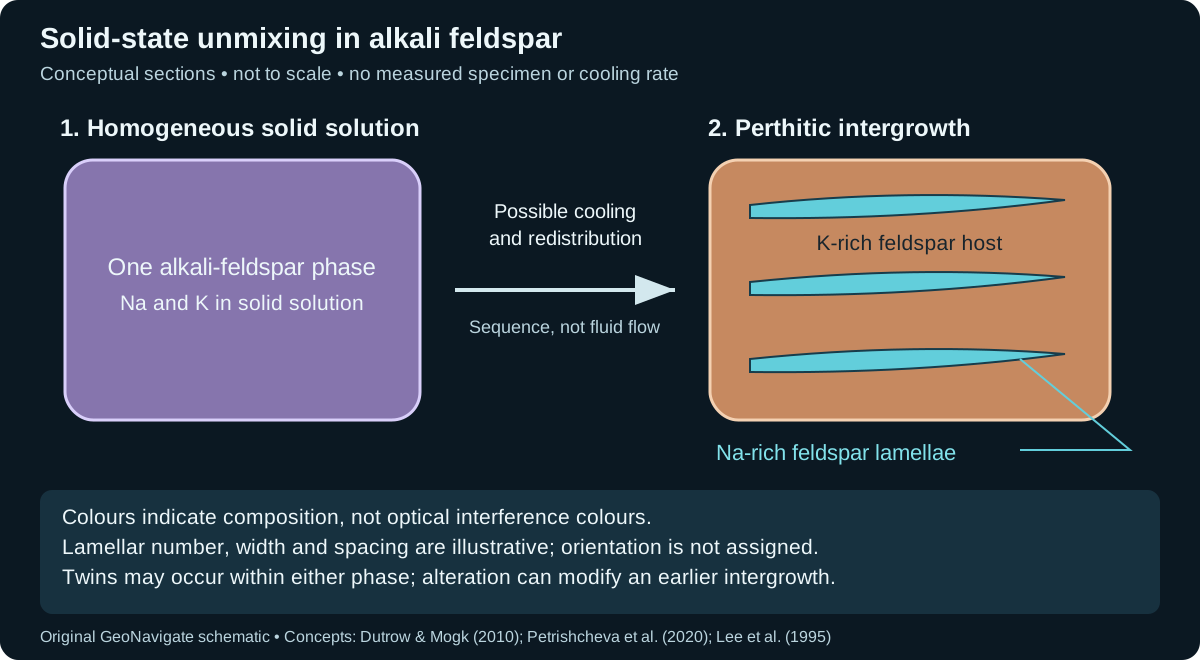
Mineral exsolution is solid-state unmixing. A formerly homogeneous solid solution can separate into compositionally different phases as conditions change. In perthite, sodium-rich feldspar occurs within a potassium-rich host. The drawing below shows one possible simplified history; it does not prescribe the temperature or time needed in a natural grain.
Worked interpretation: three different observations
| Observation | Defensible description | Next distinction |
|---|---|---|
| A: parallel light and dark bands change brightness as a thin section is rotated under crossed polars. | Record an optical banding pattern. | Test for polysynthetic twinning; brightness does not establish a chemical difference. |
| B: a resolved chemical map identifies three Na-rich lamellae inside a K-rich feldspar host. | Describe a perthitic intergrowth and state the analytical resolution. | Evaluate exsolution alongside evidence of later alteration. Three visible lamellae do not mean three cooling events. |
| C: irregular patches cut across an earlier lamellar pattern and contain pores. | Record the cross-cutting relationship and porosity separately. | Investigate replacement; do not reconstruct an unmodified cooling history from patch shape alone. |
What the example does and does not resolve
For B, first outline the analysed host, then locate each chemically resolved lamella. Report “Na-rich feldspar lamellae in a K-rich feldspar host,” rather than converting the number of bands into an event count. A chemical map that averages across several narrow domains may hide the contrast. The three drawn lamellae are an illustration choice, not a prediction of spacing, abundance or phase proportions.
Twinning concerns crystallographic orientation; exsolution concerns separation into distinct compositions. They can coexist: the Shap granite study describes twinned albite in perthitic intergrowths and later dissolution–reprecipitation that modifies earlier textures. Thus, finding twins does not rule out exsolution. In drill cuttings, distinguish a texture preserved inside one chip from the accidental arrangement of loose fragments.
Laboratory annealing in Petrishcheva and colleagues' study produced chemical separation followed by coarsening under controlled conditions. Applying that behaviour to a natural specimen needs its composition, thermal history, microstructure and possible fluid overprint. Neither this cartoon nor one lamellar width supplies a unique cooling rate. Keep unresolved alternatives in the description.
References and scope
Original teaching exercise checked 27 October 2026. Dutrow and Mogk (2010), SERC/NAGT exsolution teaching activity; Petrishcheva et al. (2020), abstract and introduction; Lee, Waldron and Parsons (1995), Shap granite microtextures, publisher abstract. No source artwork is reproduced and no expert review is claimed. See the wellsite glossary entry, Chaser Geological wellsite services, or contact the team.
Worked example: mineral composition versus phase abundance
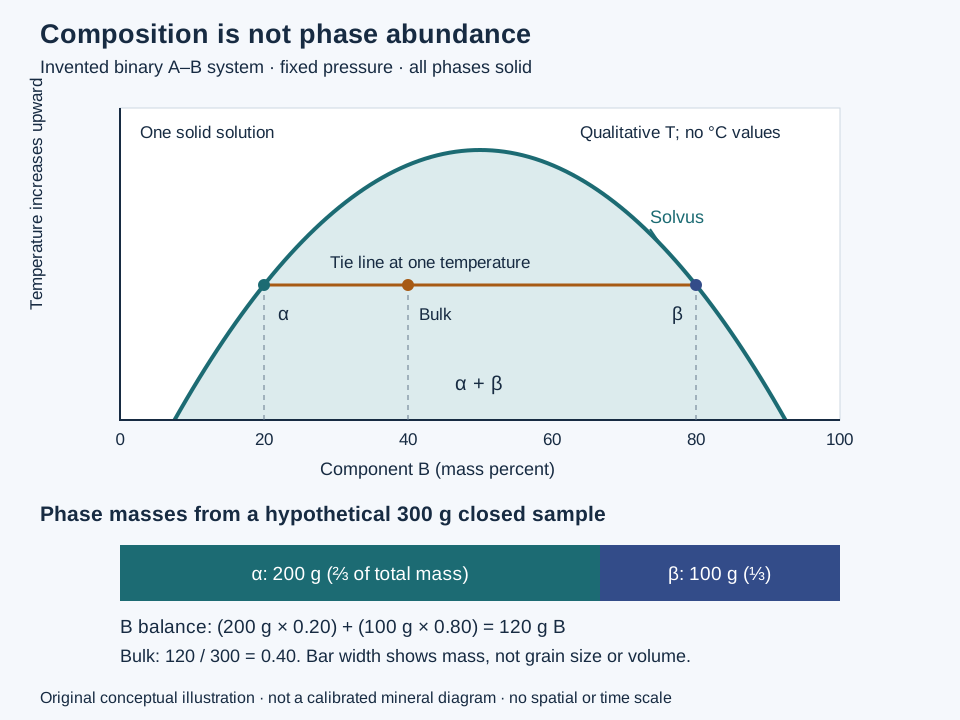
A chemical analysis tells you what a domain contains; it does not automatically tell you how much of that domain occurs in the sample. The lever rule connects these questions through a balance. This example extends the exsolution discussion above, using invented components A and B rather than a calibrated feldspar system.
State the system before reading the line
Assume a closed, binary A–B sample at fixed pressure and a chosen temperature. Both phases are solids and equilibrium is stipulated. The solvus bounds the two-solid region shown. At this temperature its intersections with the horizontal tie line specify phase α containing 20 mass percent B and phase β containing 80 mass percent B. The whole sample contains 40 mass percent B. Neither endpoint is a phase abundance.
Calculate and check a 300 g sample
Let fα and fβ be fractions of the total mass. They must satisfy fα + fβ = 1 and 0.20fα + 0.80fβ = 0.40. Solving gives fα = (0.80 − 0.40)/(0.80 − 0.20) = 2/3 and fβ = (0.40 − 0.20)/(0.80 − 0.20) = 1/3. The opposite tie-line segment belongs in each numerator.
| Quantity | Phase α | Phase β | Total |
|---|---|---|---|
| Phase mass | 200 g | 100 g | 300 g |
| Mass of B | 200 × 0.20 = 40 g | 100 × 0.80 = 80 g | 120 g |
| Mass of A | 160 g | 20 g | 180 g |
The check is 120/300 = 0.40, recovering the stipulated bulk composition. A phase with 80% B occupies only one-third of the sample mass here. Confusing those two percentages would fail the balance.
Change the bulk, hold the endpoints fixed
A second 300 g sample at the same conditions has 50 mass percent B. The same endpoints give equal masses: 150 g of each phase, containing 30 + 120 = 150 g B. Changing the bulk composition inside this two-phase interval changes amounts while the stipulated equilibrium endpoints remain fixed. A bulk value of 90% B lies outside this interval; negative phase fractions from the formula would flag misuse of this particular tie line, not a physical negative mass.
What a thin section or cutting cannot supply alone
Mass fractions cannot be read directly as area or volume percentages. Converting masses into volumes requires the densities of both phases. Likewise, do not insert atomic, molar and mass percentages into the same balance. A real diagram needs the appropriate components, pressure and equilibrium relations; this drawing supplies no temperatures for a natural rock.
In a perthitic intergrowth, chemical measurements may resolve host and lamella compositions. They do not by themselves demonstrate that every domain equilibrated at one temperature or that the original grain stayed closed to fluids. Reconstructing a precursor from present compositions requires a representative domain inventory and a consistent balance; counting lamellae is not a mass measurement. Preserve evidence of replacement, zoning and unresolved fine material. Neither the balance nor the schematic determines a cooling rate.
References and scope
Concept references checked 28 October 2026: Stephen A. Nelson, Tulane University: Two Component (Binary) Phase Diagrams for mineral phase relations; University of Southampton: Tie Lines and the Lever Rule for the balance; Mineralogy: Igneous Rocks and Silicate Minerals for feldspar context. Original explanation, invented arithmetic and artwork; no external expert review claimed. Compare the Oilfield Glossary entry, Chaser Geological wellsite services, or contact Chaser Geological.
Calcite and aragonite: composition is not crystal structure
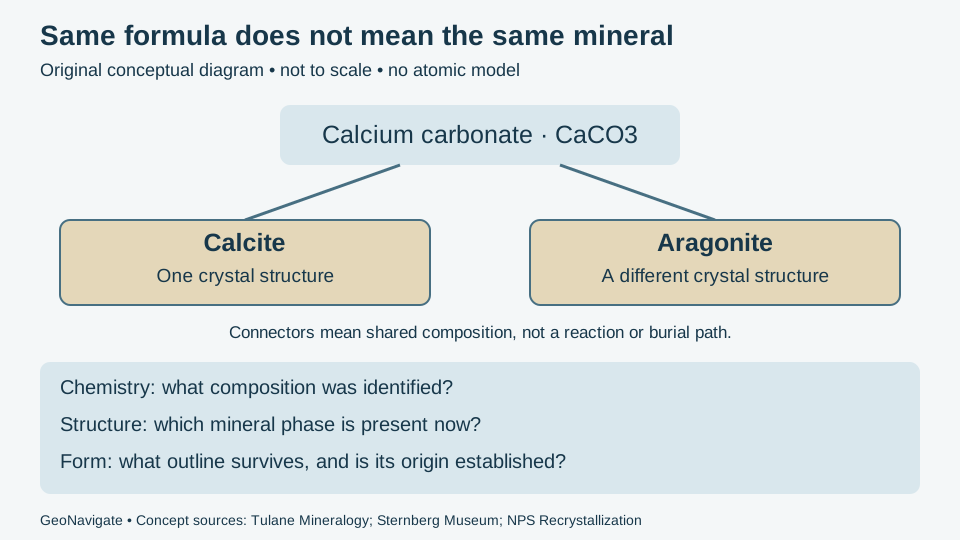
Polymorphism separates chemical composition from internal arrangement. Calcite and aragonite share the ideal formula CaCO3. Their crystal structures differ. The Sternberg Museum explanation also distinguishes polymorphism from habit, the external growth form, and pseudomorphism, inherited form after replacement.
Worked identification: change the evidence, not the conclusion by guesswork
- Only composition is known: an invented analysis identifies calcium carbonate. Retain “calcium carbonate; phase unresolved.” The formula alone cannot choose calcite or aragonite. These are common examples, not an exhaustive list of CaCO3 phases.
- Structure-sensitive evidence is added: suppose a properly interpreted diffraction result identifies calcite. Record calcite as the current phase within the analysis's detection and sampling limits. Do not claim that all material in the formation is calcite.
- A shell outline is also visible: record the fossil form separately. The outline does not overturn the current mineral identification, nor does it independently prove an aragonitic precursor.
As a separate hypothetical count, 8 of 10 selected fragments show a shell outline. That is 80% of the selected fragments with visible form, not 80% aragonite, an age determination or a formation-wide fossil abundance. No mineral phase has been measured by that count.
Use preservation history carefully
The National Park Service fossilization explanation describes replacement of aragonite by calcite and possible loss of fine detail. This provides a plausible history to test, not a universal rule for every fossil. Its use of recrystallization is specific to that discussion; do not replace the broader meaning of every recrystallization process with this one example.
For a wellsite description, keep present mineral identity, visible fabric and proposed alteration in separate statements. Compare intact material, petrography and suitable mineral analysis where the distinction matters. Mixed cuttings, coatings and incomplete recovery can obscure relationships. A surviving shell shape alone supplies neither original mineralogy nor reservoir porosity; dissolution, cement and replacement require their own observations.
References and next steps
Concept sources checked 28 October 2026: the museum and NPS pages above, and Stephen Nelson, Tulane University: Twinning, Polymorphism, Polytypism, Pseudomorphism. Original exercise and artwork; no field measurements, reproduced figures or external expert review claimed. Compare mineral replacement, the Oilfield Glossary and Chaser wellsite services, or contact the team.
Breakage, exposed surface and weathered samples
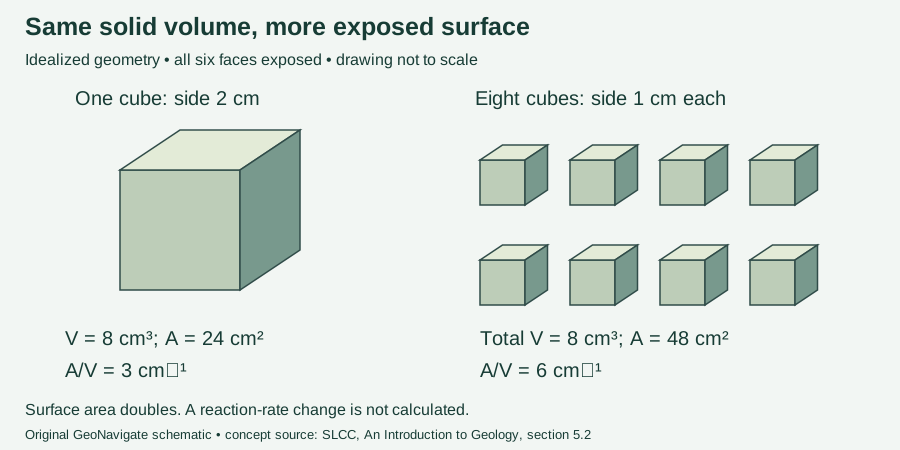
Weathering includes physical breakdown and chemical alteration in place; erosion involves transport. Physical breakage exposes surfaces that can interact with water and other reactants. The SLCC geology text, section 5.2, explains this relationship.
Worked calculation
For a cube of side a, volume is a³ and surface area is 6a². A 2 cm cube therefore has volume 8 cm³ and surface 24 cm². Divide it into eight 1 cm cubes and separate them: total volume remains 8 × 1³ = 8 cm³, while total surface becomes 8 × 6 × 1² = 48 cm². Surface-to-volume ratio increases from 3 to 6 cm⁻¹. This exact geometric comparison assumes no material loss, smooth faces and access to every face. Fragments still pressed together would not expose all these surfaces.
Application to sample descriptions
Compare a coating or discoloured exterior with a fresh broken surface and describe each observation. Keep sample interval, preparation and storage history with the photographs. Fragmentation during drilling or preparation is not itself proof of natural weathering. Likewise, twice the geometric surface does not guarantee twice a chemical reaction rate: mineral identity and reaction conditions are not specified in this exercise. Use weathering terminology alongside the guide’s mineral-identification observations, rather than assigning a weathering age from chip size or colour alone.
Hydrostatic weighing: subtract before dividing
For a hypothetical impermeable specimen, suppose the weight in air is 2.65 N and the apparent weight when fully submerged in water is 1.65 N. The difference, 1.00 N, represents the displaced water weight in this ideal model. Specific gravity relative to that water is 2.65/(2.65 − 1.65) = 2.65. Dividing the two readings directly gives about 1.61, which uses the wrong denominator. The lower bars in the shared diagram above compare forces, not masses or specimen sizes.
This calculation neglects air buoyancy and assumes a tared suspension, no attached bubbles, no vessel contact and no water uptake or dissolution. It is not a complete laboratory procedure for porous or friable samples. For cuttings, retain preparation and volume-basis details rather than treating a mixed, mud-coated aggregate as one mineral. Specific gravity supports identification alongside hardness, cleavage and other evidence; it does not establish mineral identity alone.
Original illustrative force values. Equation reference: Manitoba, Metric Math for Wastewater Operators, specific gravity of solids. Mineral context: Tulane mineral properties.