
GEONAVIGATE / INFINITY
Geosteering software for geological interpretation
Review gamma-ray correlation, formation dip and well trajectory with GeoNavigate Infinity and stratA/iQ.
Connect geological interpretation with the well trajectory
Geosteering uses incoming geological and directional evidence to interpret the well’s position relative to the reservoir. GeoNavigate Infinity brings gamma-ray curves, surveys, section and plan views, striplogs and team updates into a connected workspace.
The interpretation depends on the quality of the input data and the geological model. A similar gamma-ray response can have more than one explanation; a curve match should be reviewed alongside cuttings, structure and offset-well context.
What stratA/iQ does
stratA/iQ is Infinity’s automatic gamma-ray correlation option. It compares the lateral GR curve with a linked type log or offset log and searches for an improved formation-dip match within the range selected by the user. When the evidence supports an adjustment, it updates the selected interval’s dip and the formation plots.
Weak, flat or ambiguous matches leave the dip unchanged. Missing reference readings count against the fit. The geologist chooses the interval, reference and permitted search range, then reviews the interpretation.
A practical interpretation workflow
- Review the inputs. Confirm well identity, curve units, depth basis and survey datum before correlating.
- Choose the geological reference. Link the appropriate type log or offset log and establish the interval to interpret.
- Compare the evidence. Review gamma-ray character, formation picks and the trajectory in section and plan views.
- Test the dip fit. Use stratA/iQ within the selected range, then assess whether the result fits the wider geology.
- Share the interpretation. Carry reviewed views, striplogs and the geological context into team handovers and reports.
Gamma-ray correlation and forward modelling
Correlation compares measured responses between logs. Forward modelling predicts a response from an assumed geological and physical model. They are related interpretation activities, but require different inputs and assumptions. Infinity’s stratA/iQ capability described here is gamma-ray matching and interval-dip fitting; it should not be interpreted as a claim of deep-resistivity electromagnetic simulation.
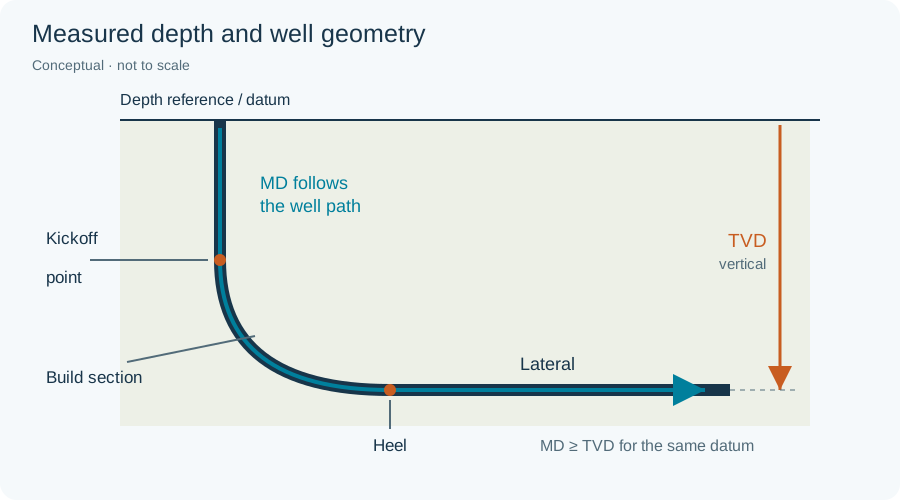
Explore the geosteering definition and search the glossary for forward modelling, inversion, measured depth and true vertical depth. For live rig-data connectivity, see GeoLink.
Worked interpretation: equal total GR, different evidence
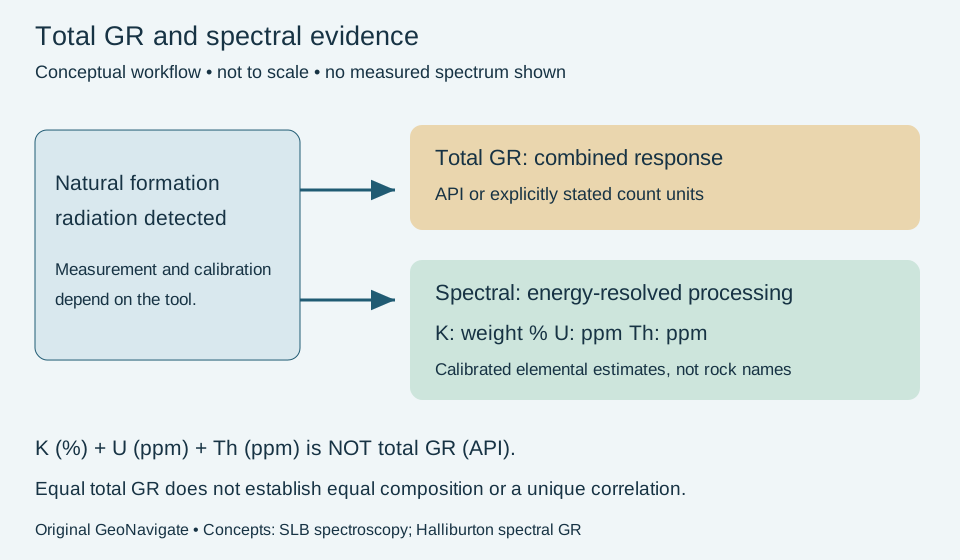
Total GR combines natural radiation into one response. Spectral GR adds energy-resolved information used to estimate potassium, uranium and thorium. A matching total curve is useful correlation evidence, but does not uniquely establish composition or formation identity.
Two hypothetical intervals
Suppose intervals A and B both read 80 API after suitable quality checks. A companion spectral interpretation reports a stronger uranium contribution in A and stronger potassium/thorium contributions in B. No elemental concentrations or conversion coefficients are stipulated here: this is a qualitative evidence comparison, not a simulated detector response.
Record the shared total response and the differing spectral character separately. The difference gives a reason to test the proposed correlation against other evidence; it does not automatically disprove it or identify either interval as shale, organic-rich rock or a fracture zone. A formation can vary laterally, and measurement conditions can also affect comparisons.
Before changing the interpretation
- Confirm curve names, units, depth matching and comparable tool processing. Total GR in API is not an elemental concentration.
- Keep K in weight percent and U/Th in ppm as reported. Do not add those three numbers to calculate API: tool response and calibration are required.
- Compare adjacent log features, cuttings, offsets and structural context. Preserve competing correlations when the evidence does not distinguish them.
- If spectral data are absent, label the compositional distinction unresolved. Do not infer unavailable component curves from the total trace alone.
Concept references checked 29 October 2026: SLB natural GR spectroscopy and Halliburton spectral GR service. This original teaching example does not claim that Infinity provides a spectral tool inversion or that these data came from a well. Compare the Oilfield Glossary and discuss interpretation support with Chaser Geological.
Discuss your geosteering workflow
For platform access, data compatibility or remote geological supervision, contact Chaser Geological. Existing users can sign in to Infinity.