
GEONAVIGATE / RESOURCES / HYDROGEOLOGY
Effective stress and compaction: a pore-pressure worked example
Track the stress carried by a saturated sediment framework and understand the limits of a simple compaction interpretation.
Separate the load from the pore pressure
At a chosen depth, the weight above contributes to total vertical stress. Water pressure and the solid framework share that load. In a saturated-soil teaching model, σ′v = σv − u: effective vertical stress equals total vertical stress minus pore-water pressure. All three quantities must use consistent units and pressure references. Here compression is positive.
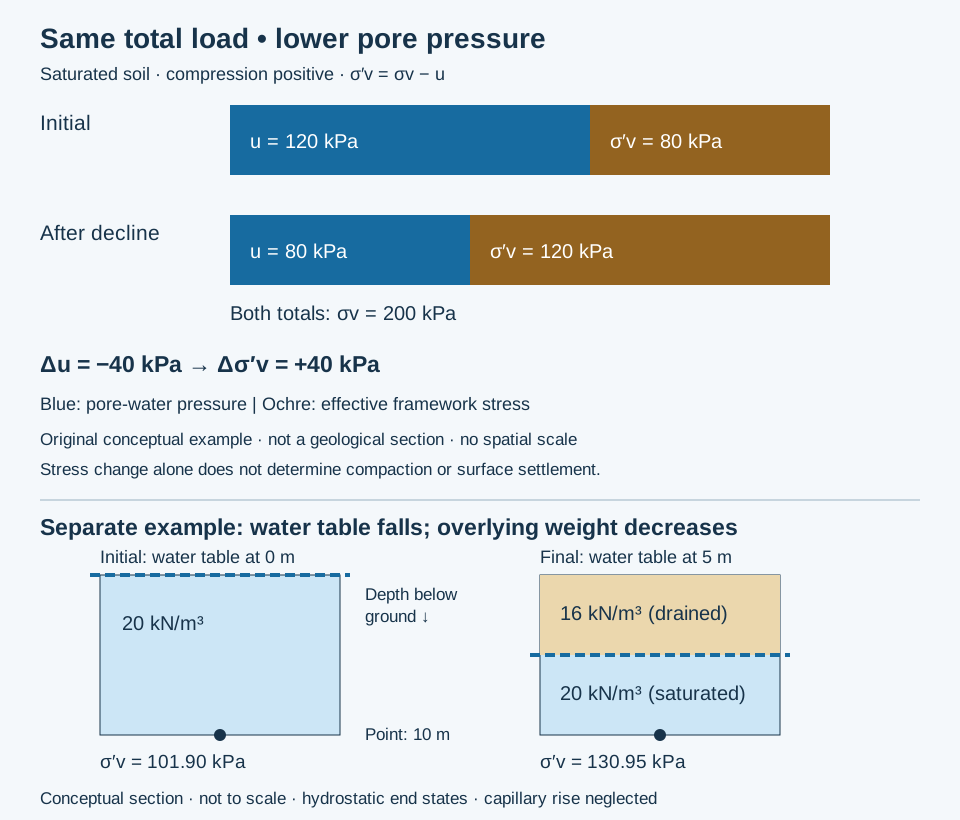
Worked example: lower pressure, unchanged load
Consider an invented observation point in a confined saturated sediment. Hold total vertical stress at 200 kPa. Initially u = 120 kPa, so σ′v = 200 − 120 = 80 kPa. After pressure declines to 80 kPa, σ′v = 200 − 80 = 120 kPa. The pressure decline of 40 kPa produces an effective-stress increase of 40 kPa, or 50% relative to the initial 80 kPa.
Translate a head change carefully
At the same fixed elevation, a 40 kPa water-pressure decline corresponds to about 4.08 m of hydraulic-head decline when water unit weight is 9.81 kN/m³: 40 / 9.81 = 4.08 m. This is a pressure-head conversion, not a prediction of water-table movement or surface settlement. If the water table or surface loading changes, reassess total stress rather than assuming it remains fixed.
Why this is not a subsidence forecast
Compaction depends on material compressibility, layer thickness, drainage and loading history. Low-permeability confining beds may continue compacting while pressure equilibrates. Surface movement depends on the geometry and distribution of that deformation. A stress calculation alone cannot provide centimetres of settlement.
Compare the final effective stress with the preconsolidation stress. Crossing the yield threshold can cause a larger, largely permanent reduction in pore space. Pressure recovery therefore need not restore the original elevation or storage capacity. Below the threshold, aquifer models commonly describe a smaller recoverable response.
Apply the idea to geological interpretation
When interpreting a compacted interval, distinguish added burial load from fluid-pressure decline. Record the pressure datum, saturation, lithology and evidence for prior loading. Cemented reservoir rocks may require poroelastic coefficients and a three-dimensional stress model; the simple saturated-soil expression used here is not a universal rock-failure criterion or a mud-weight recommendation.
Worked example: a falling water table also changes the load
Take a separate hypothetical sediment column with a fixed observation point 10 m below ground. Initially the water table is at the surface and saturated bulk unit weight is 20 kN/m³. Then the water table falls to 5 m depth; prescribe 16 kN/m³ for the drained upper 5 m and retain 20 kN/m³ below. Compare hydrostatic end states, neglect capillary rise and deformation, and use gauge pressure with water unit weight 9.81 kN/m³.
- Initially: σv = 20 × 10 = 200 kPa; u = 9.81 × 10 = 98.10 kPa; σ′v = 101.90 kPa.
- Finally: σv = 16 × 5 + 20 × 5 = 180 kPa; u = 9.81 × 5 = 49.05 kPa; σ′v = 130.95 kPa.
- Change: Δσ′v = −20 − (−49.05) = +29.05 kPa.
Ignoring the 20 kPa load reduction would give an increase of 49.05 kPa instead. The observation point stays saturated in both states; this is not an effective-stress calculation for the unsaturated upper layer. Actual bulk unit weights and capillary conditions need evidence. Transient seepage can differ from these hydrostatic states. See total vertical stress and pore-water pressure.
Sources and next steps
- UWE GeotechniCAL: Stress in the ground — total stress, pore pressure and effective stress.
- The Groundwater Project: General concepts — pressure decline and deformation.
- The Groundwater Project: Effective intergranular stress — framework properties and stress history.
- USGS MODFLOW SUB-package report — elastic and inelastic aquifer-system compaction.
Original explanation and hypothetical examples prepared 25–30 October 2026; no measured field result or expert review is claimed. Continue with the groundwater-flow worked example, Oilfield Glossary or Chaser wellsite services. Contact GeoNavigate about geological workflows.