CHAPTER 01
A line through the story
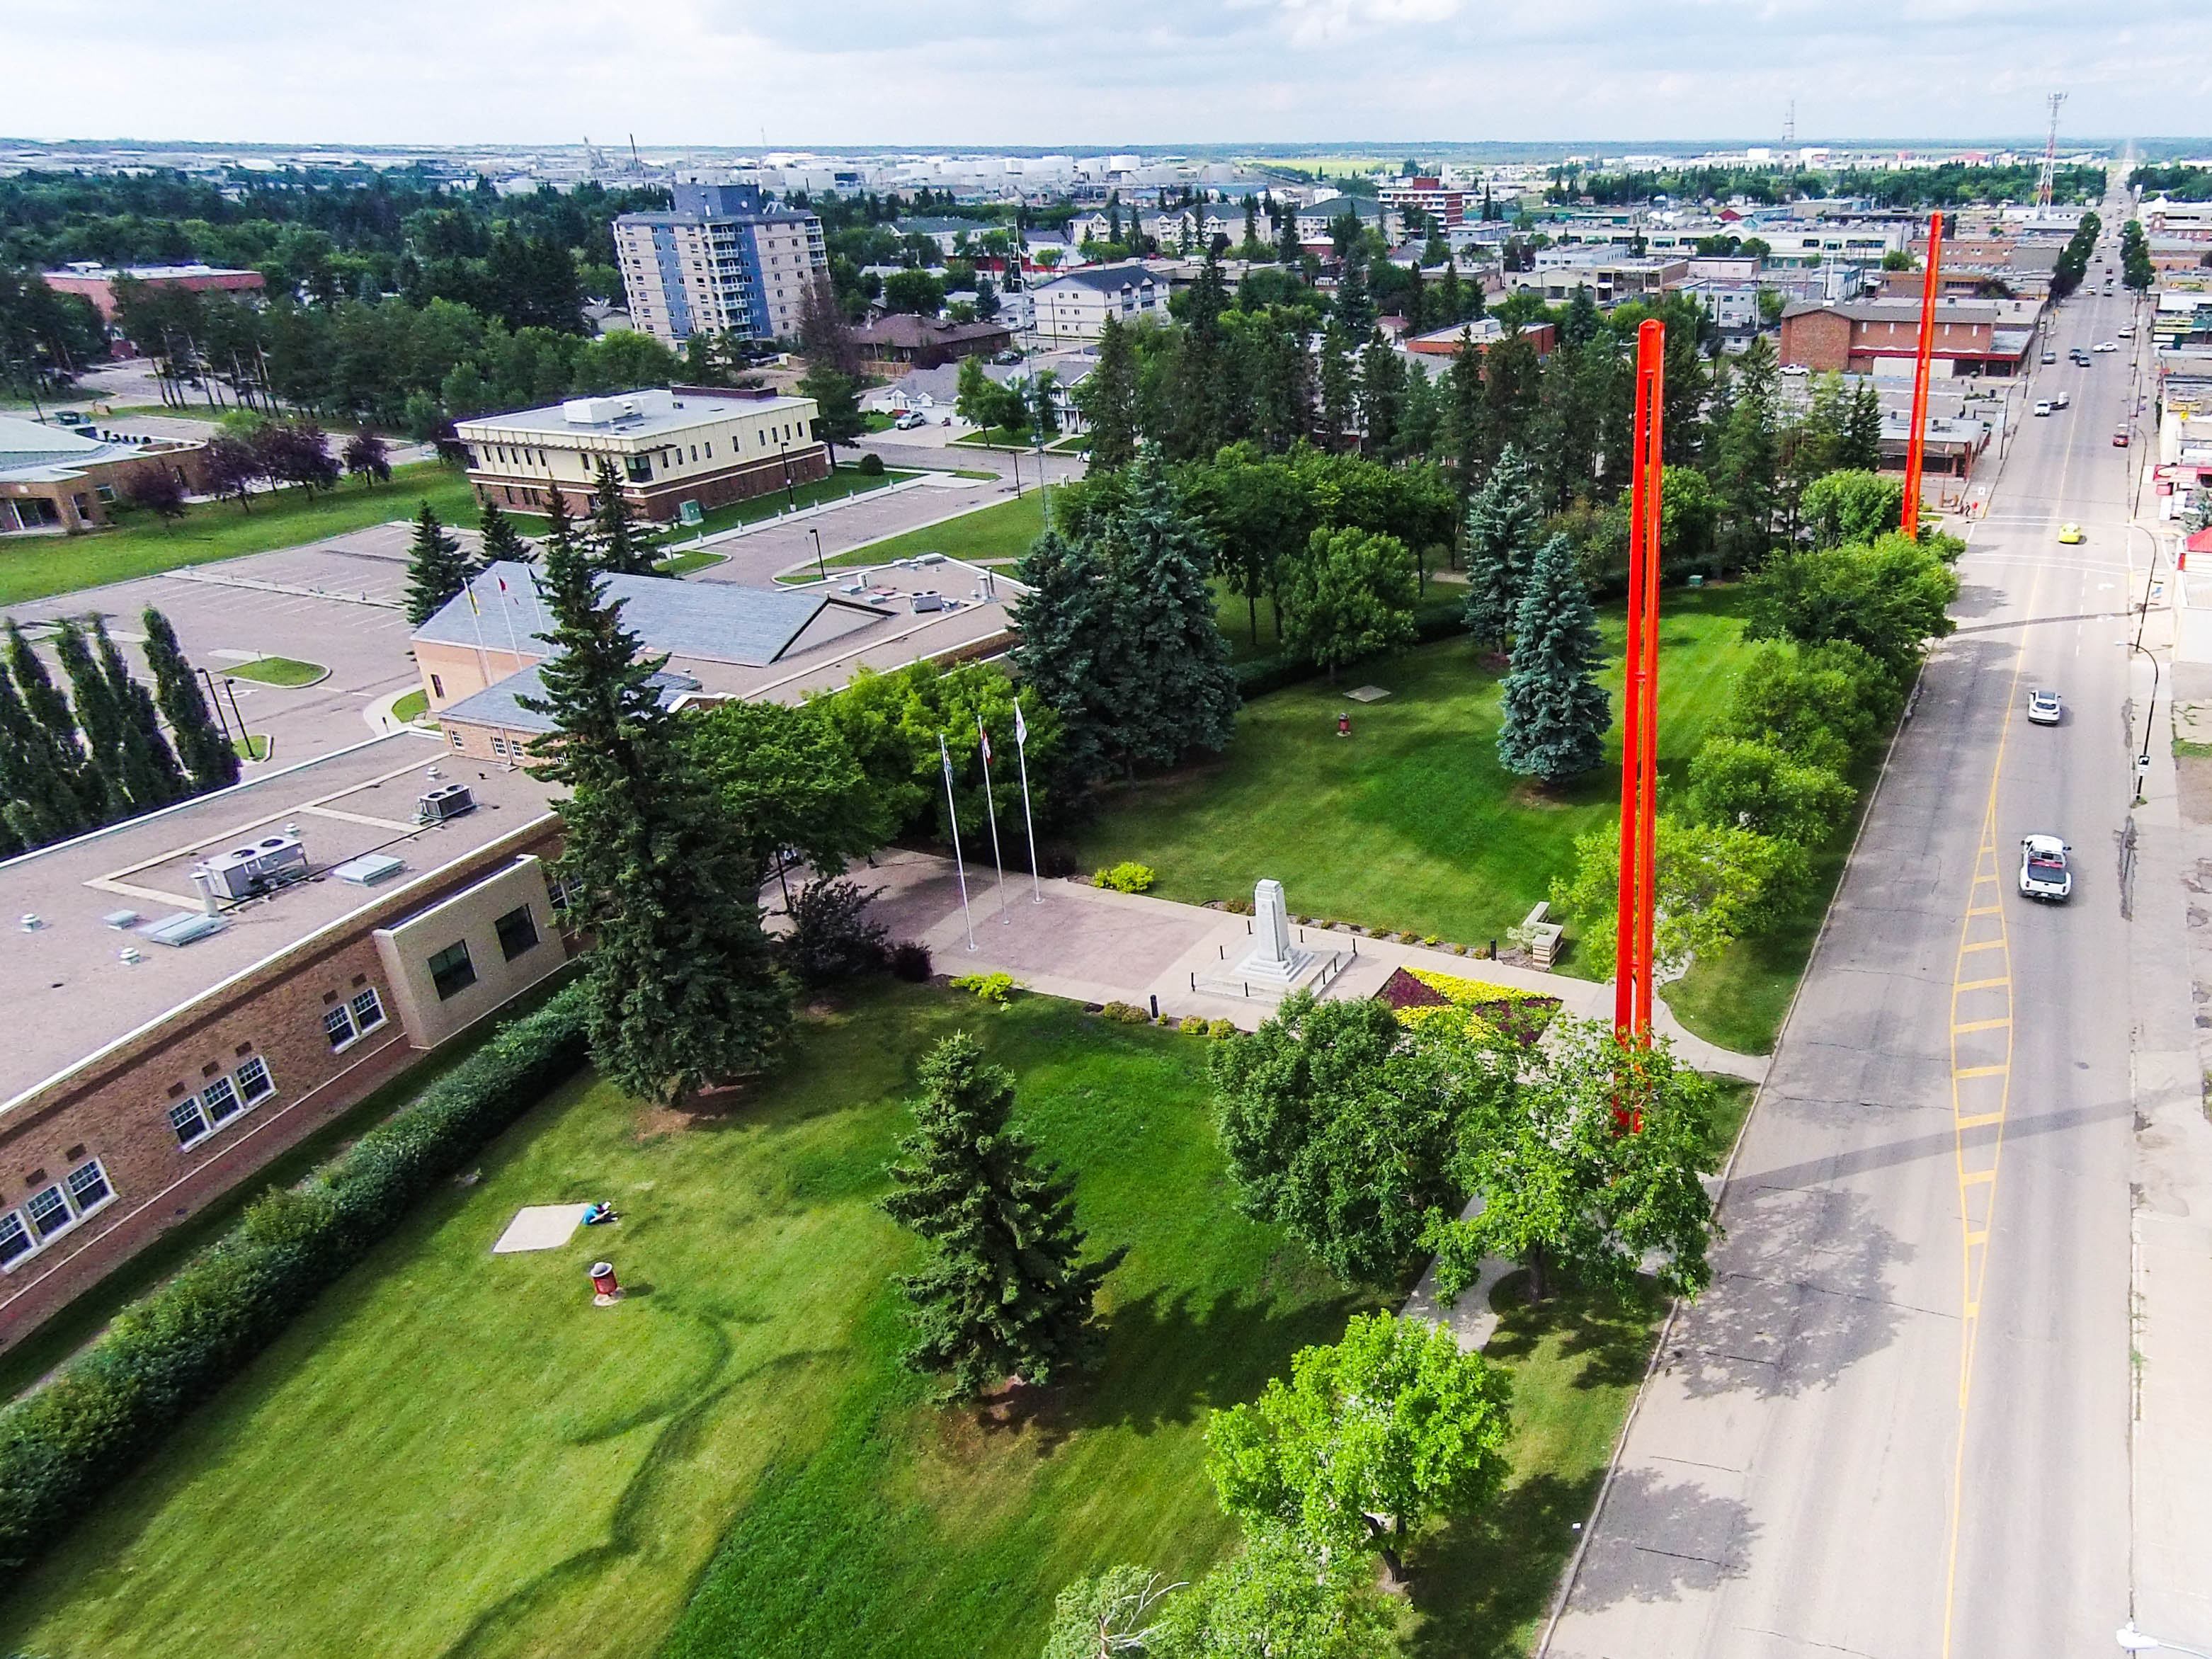
Stand in Lloydminster and a provincial boundary becomes part of an ordinary place. Streets, businesses, homes, traffic. Alberta on one side. Saskatchewan on the other. Beneath them, the rocks belong to a much older landscape, one that never encountered either name.
Now ask a question that sounds simple: when was Saskatchewan's first oil discovered?
Follow the Lloydminster story and several dates appear. A promising find. A commercial discovery. A well placed on production. Each can be accurate, while describing a different achievement. Move across the provincial line, and the record changes again.
There is a second puzzle. Finding this oil was only the beginning. It had to travel through tiny spaces between grains, enter a well, survive a trip through equipment, reach a buyer, and become something someone could use. Heavy oil made every step matter.
This is GeoNavigate Industry Chatter, with AI narration by Dorian.
Today we are following the evidence from a provincial border to a producing sand, from a newspaper report to the inside of a pump, and from an early discovery to the roads and industrial facilities that gave it a market.
Along the way, a material that obstructed early production will acquire a surprising role. Sand can damage equipment and interrupt flow. Under the right conditions, producing some of that sand can also help oil reach a well.
That development belongs decades after the first discoveries. To understand how the industry got there, we need to keep two clocks running: the long clock of geology, and the much shorter clock of people learning what these reservoirs would allow.
CHAPTER 02
One community, two provincial records
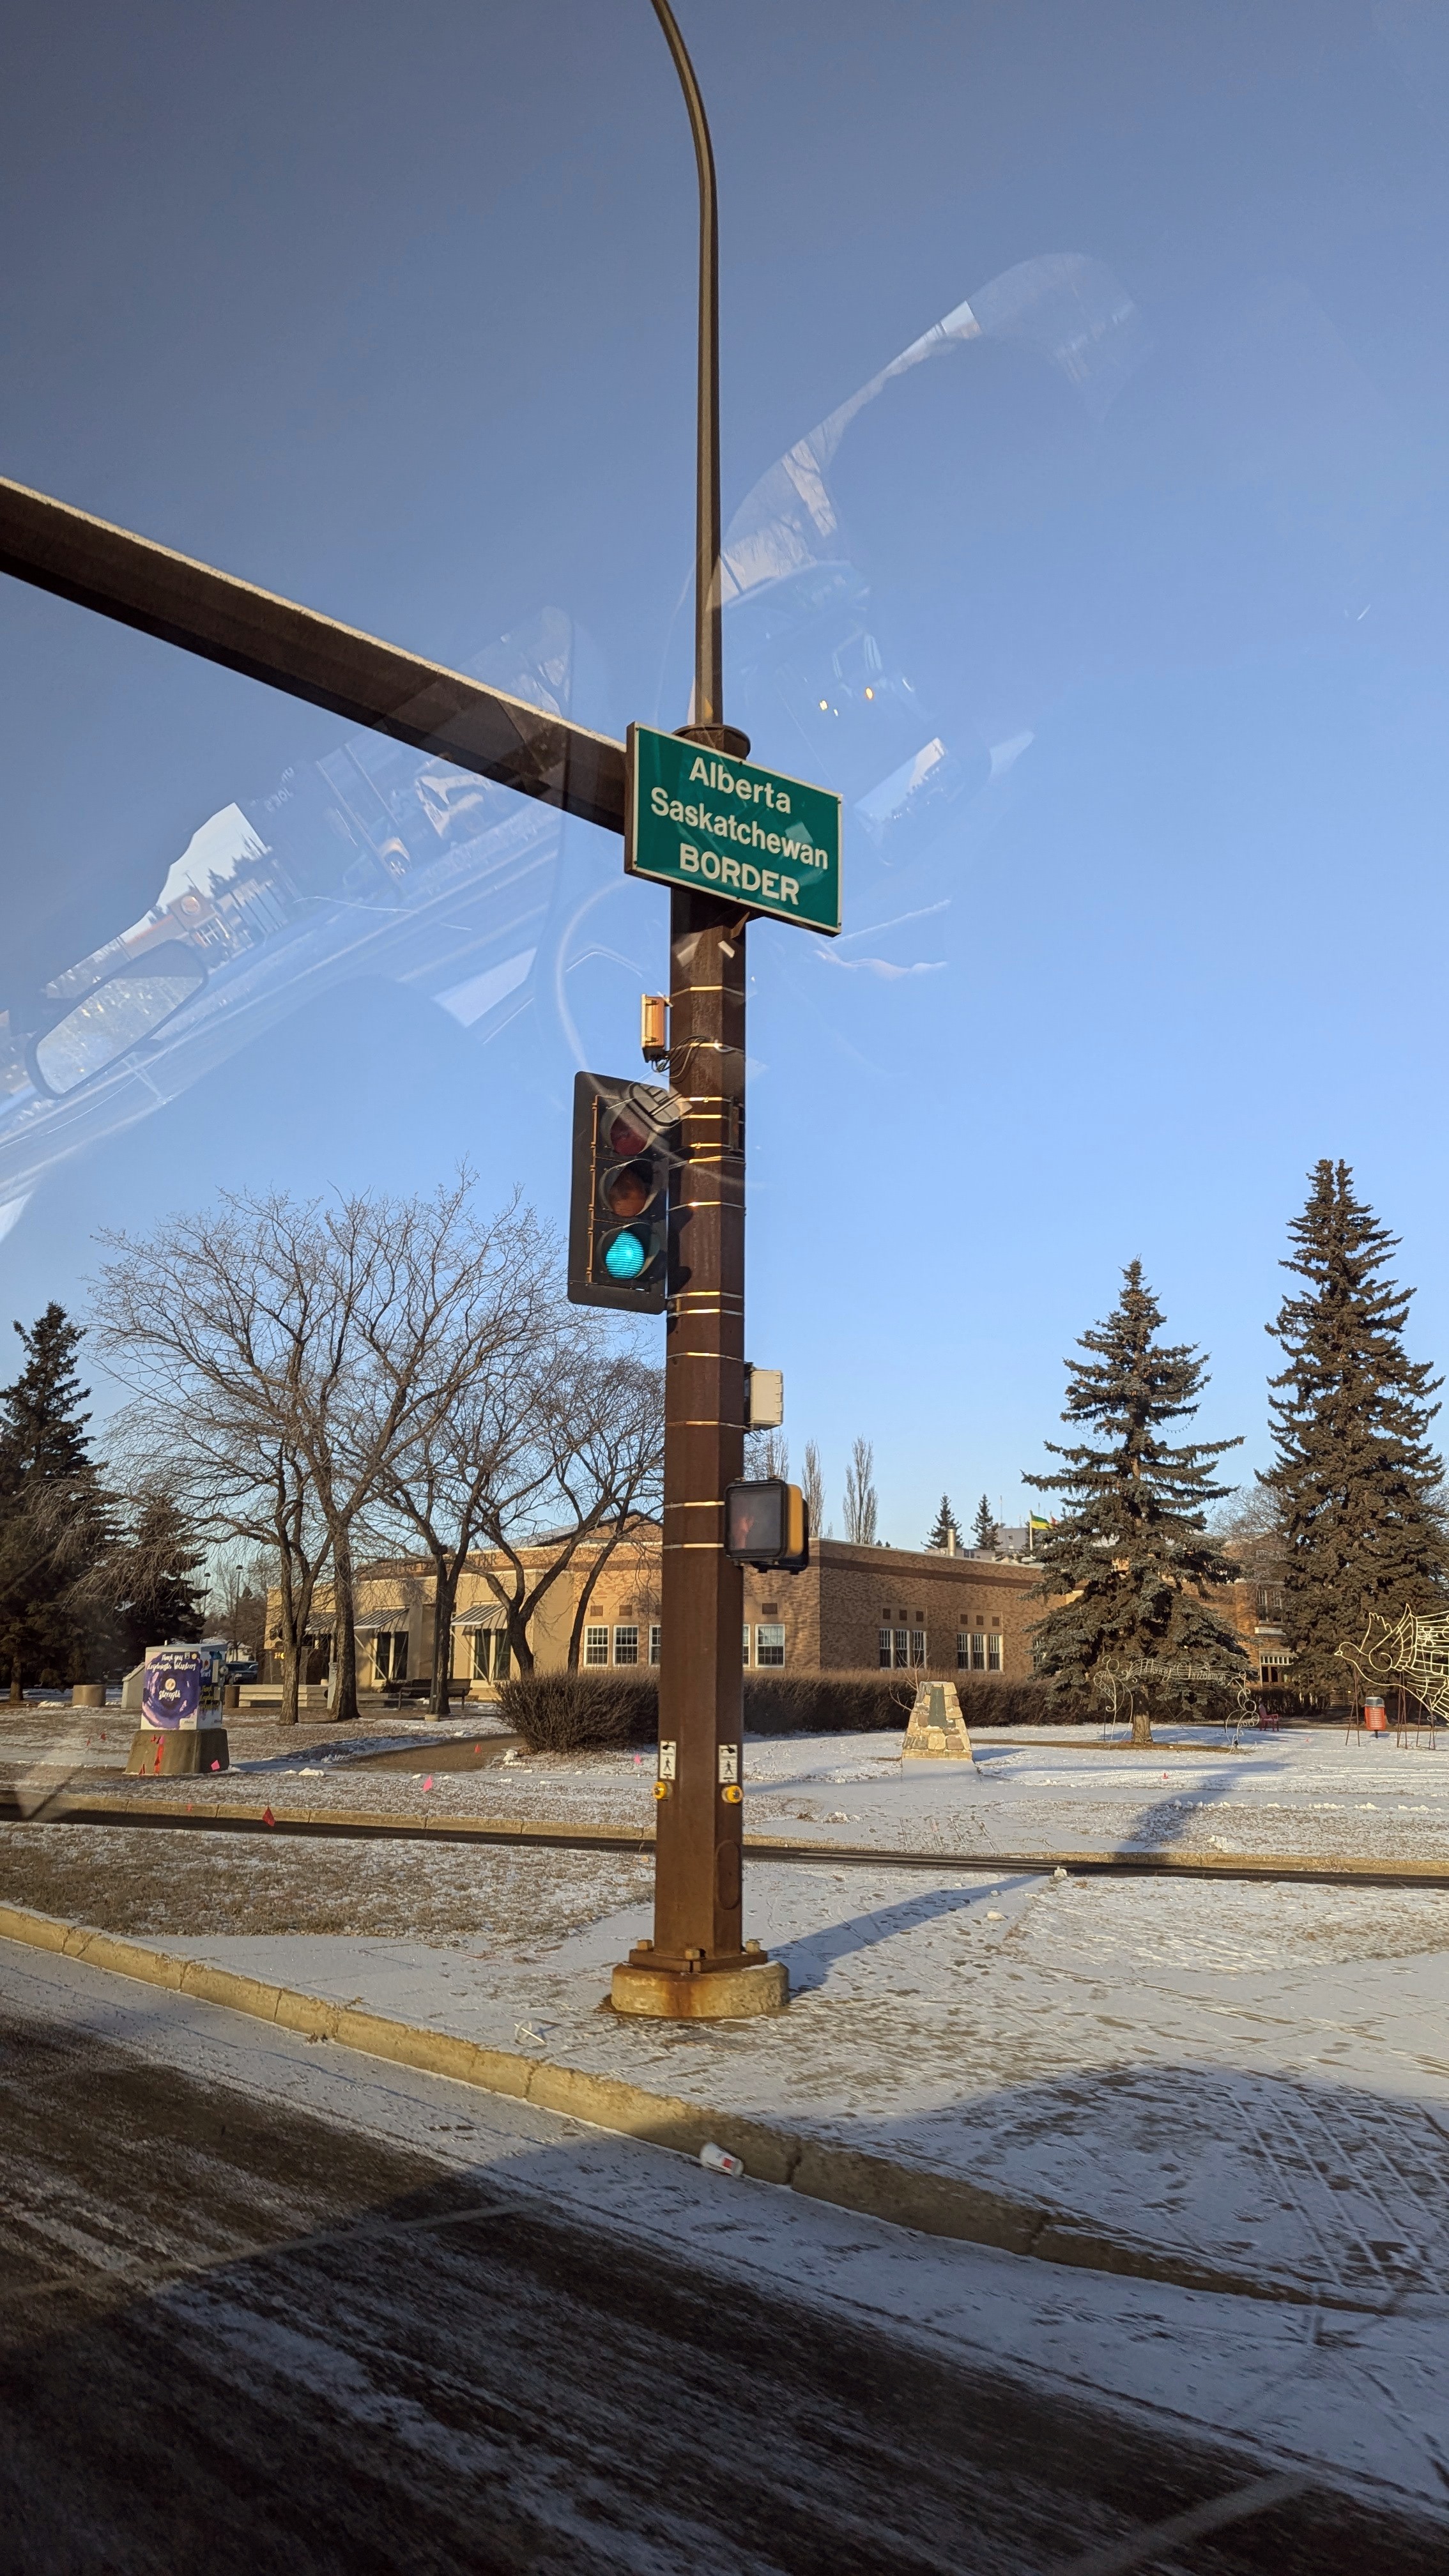
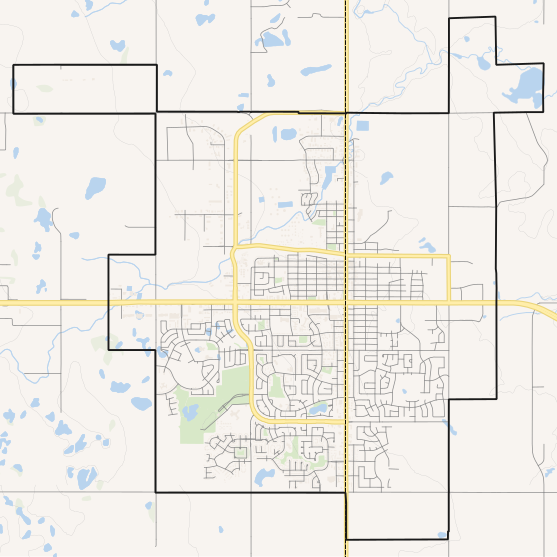
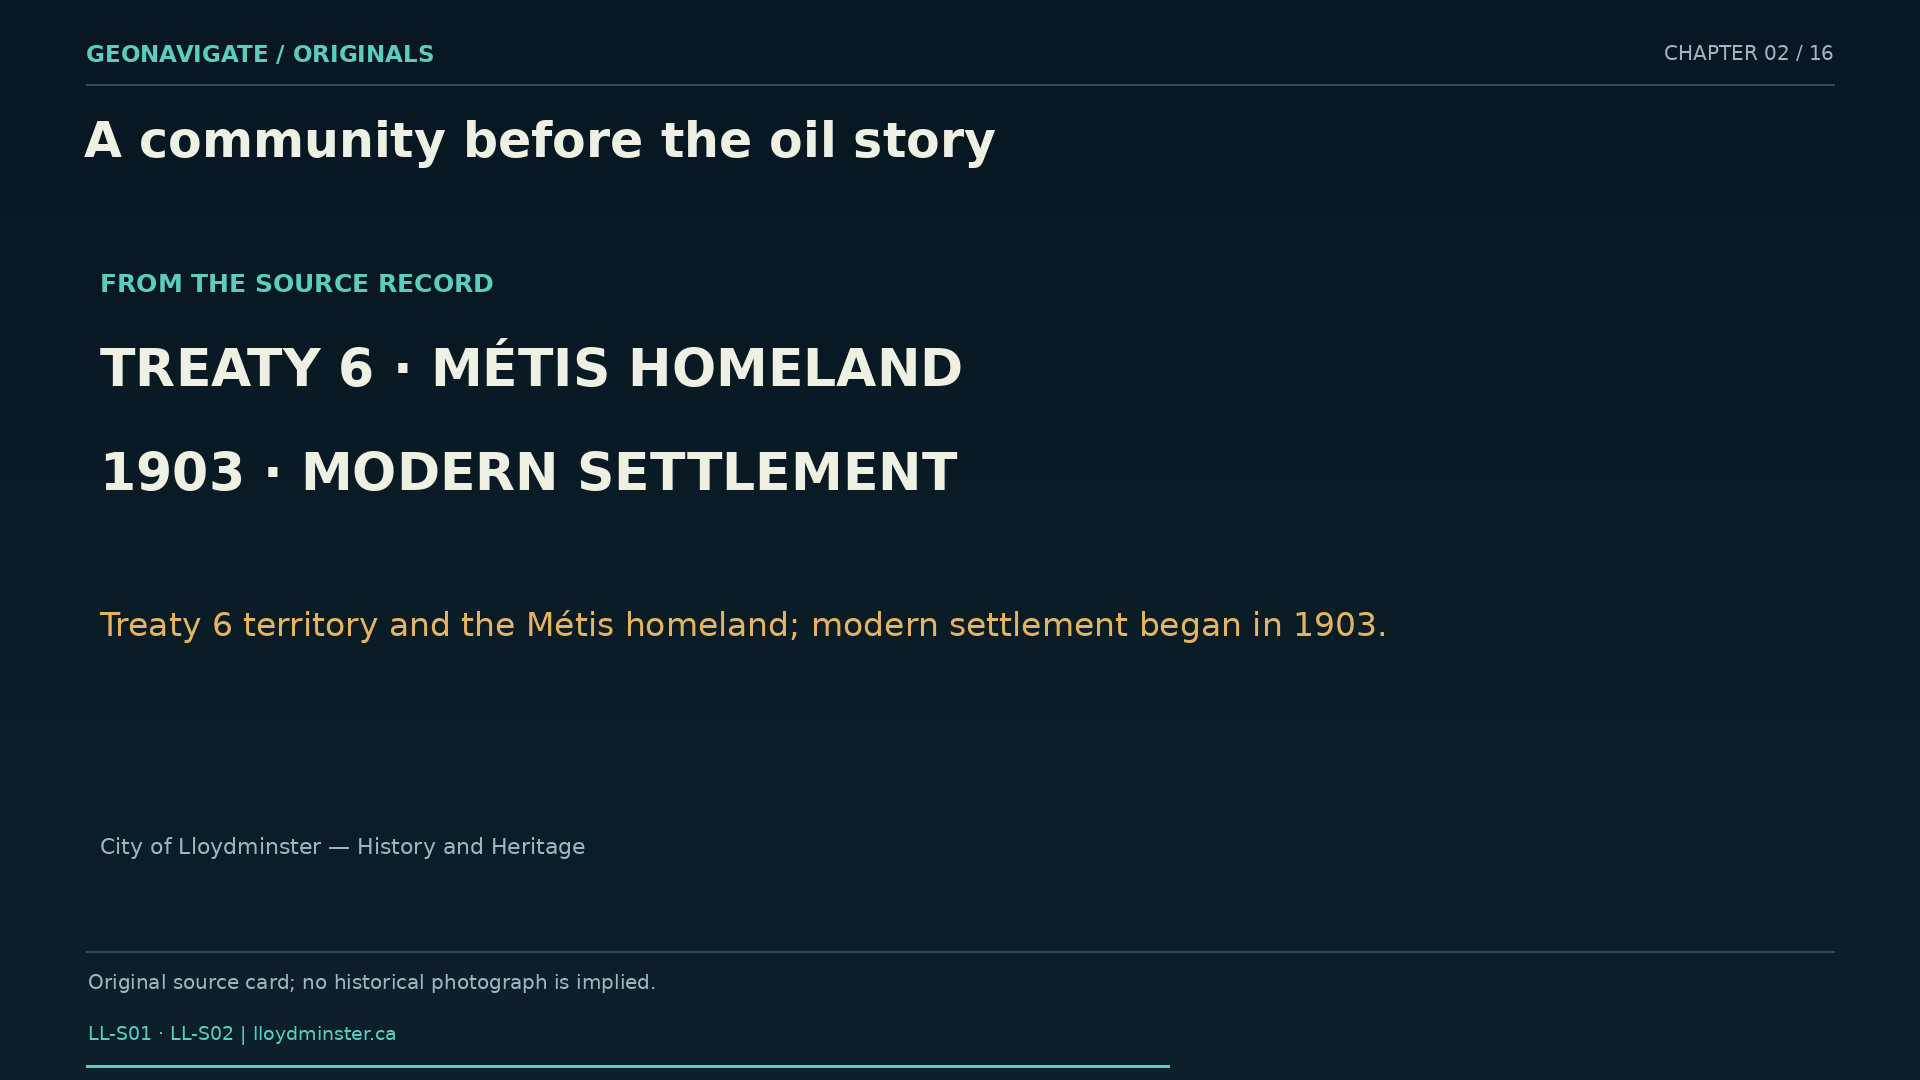
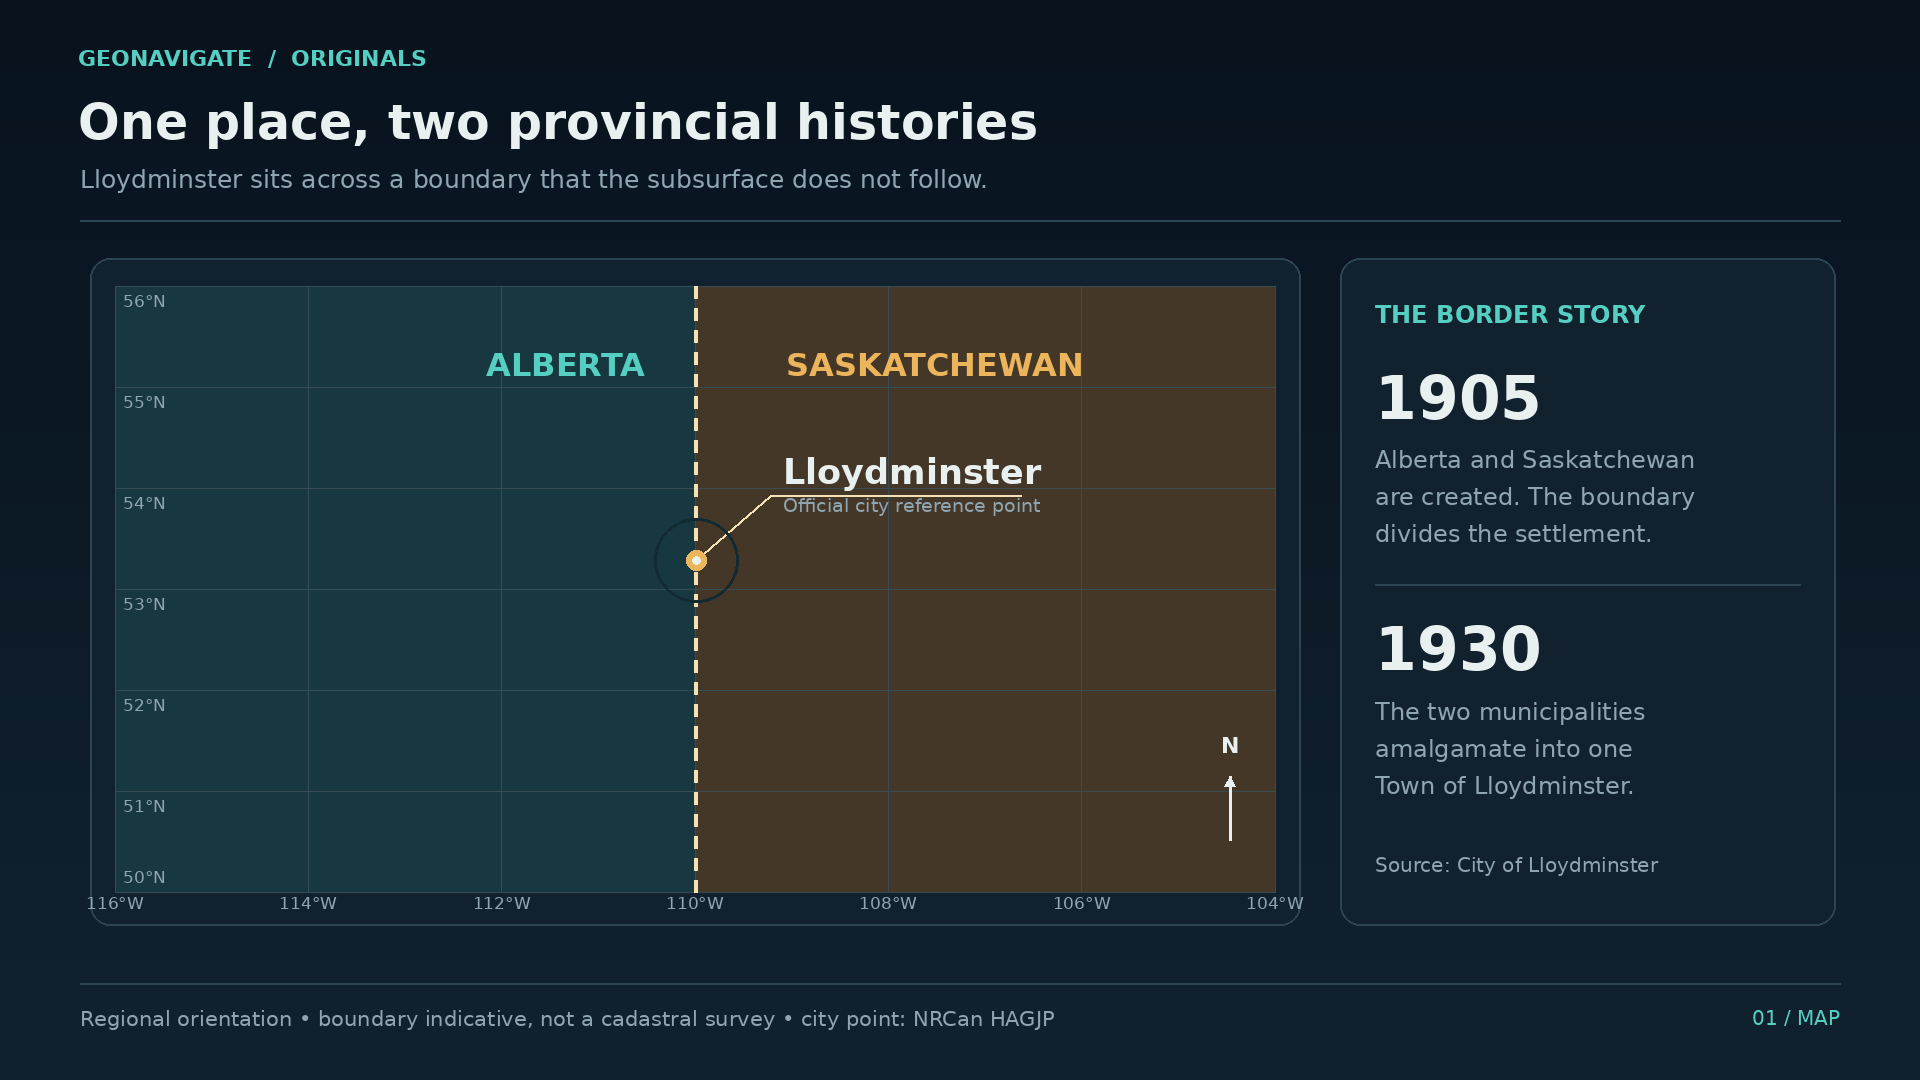
The city's history reaches beyond petroleum and beyond the boundary itself. Lloydminster identifies its location as Treaty Six territory and part of the Métis homeland. The modern settlement developed in nineteen oh three. Two years later, the creation of Alberta and Saskatchewan placed the provincial boundary through the community along the Fourth Meridian.
There were two municipalities. In nineteen thirty, they amalgamated. One community would continue to live with a line that mattered to governments and to the recording of its development.
That arrangement gives an oil historian a particular problem. Lloydminster can mean the city. It can also mean a producing district extending into both provinces. A reference to a discovery near Lloydminster does not, by itself, tell us which provincial history it belongs to.
We therefore need two pieces of information for each milestone: what happened, and where. A regional discovery on the Alberta side cannot automatically become Saskatchewan's first producing well. And a later Saskatchewan milestone does not erase the earlier work across the line.
The map helps us ask better questions, but it has limits. A dot marking the city is a reference point. It does not locate National Grant Number One, or trace the outline of an underground pool. Those require their own records.
Keep that distinction in mind as we leave the streets and move into the archives. The border will stay on our map. The story will cross it repeatedly, because the geology, the workforce, the equipment, and the market connections all extend beyond a single provincial column.
CHAPTER 03
Several dates, different achievements
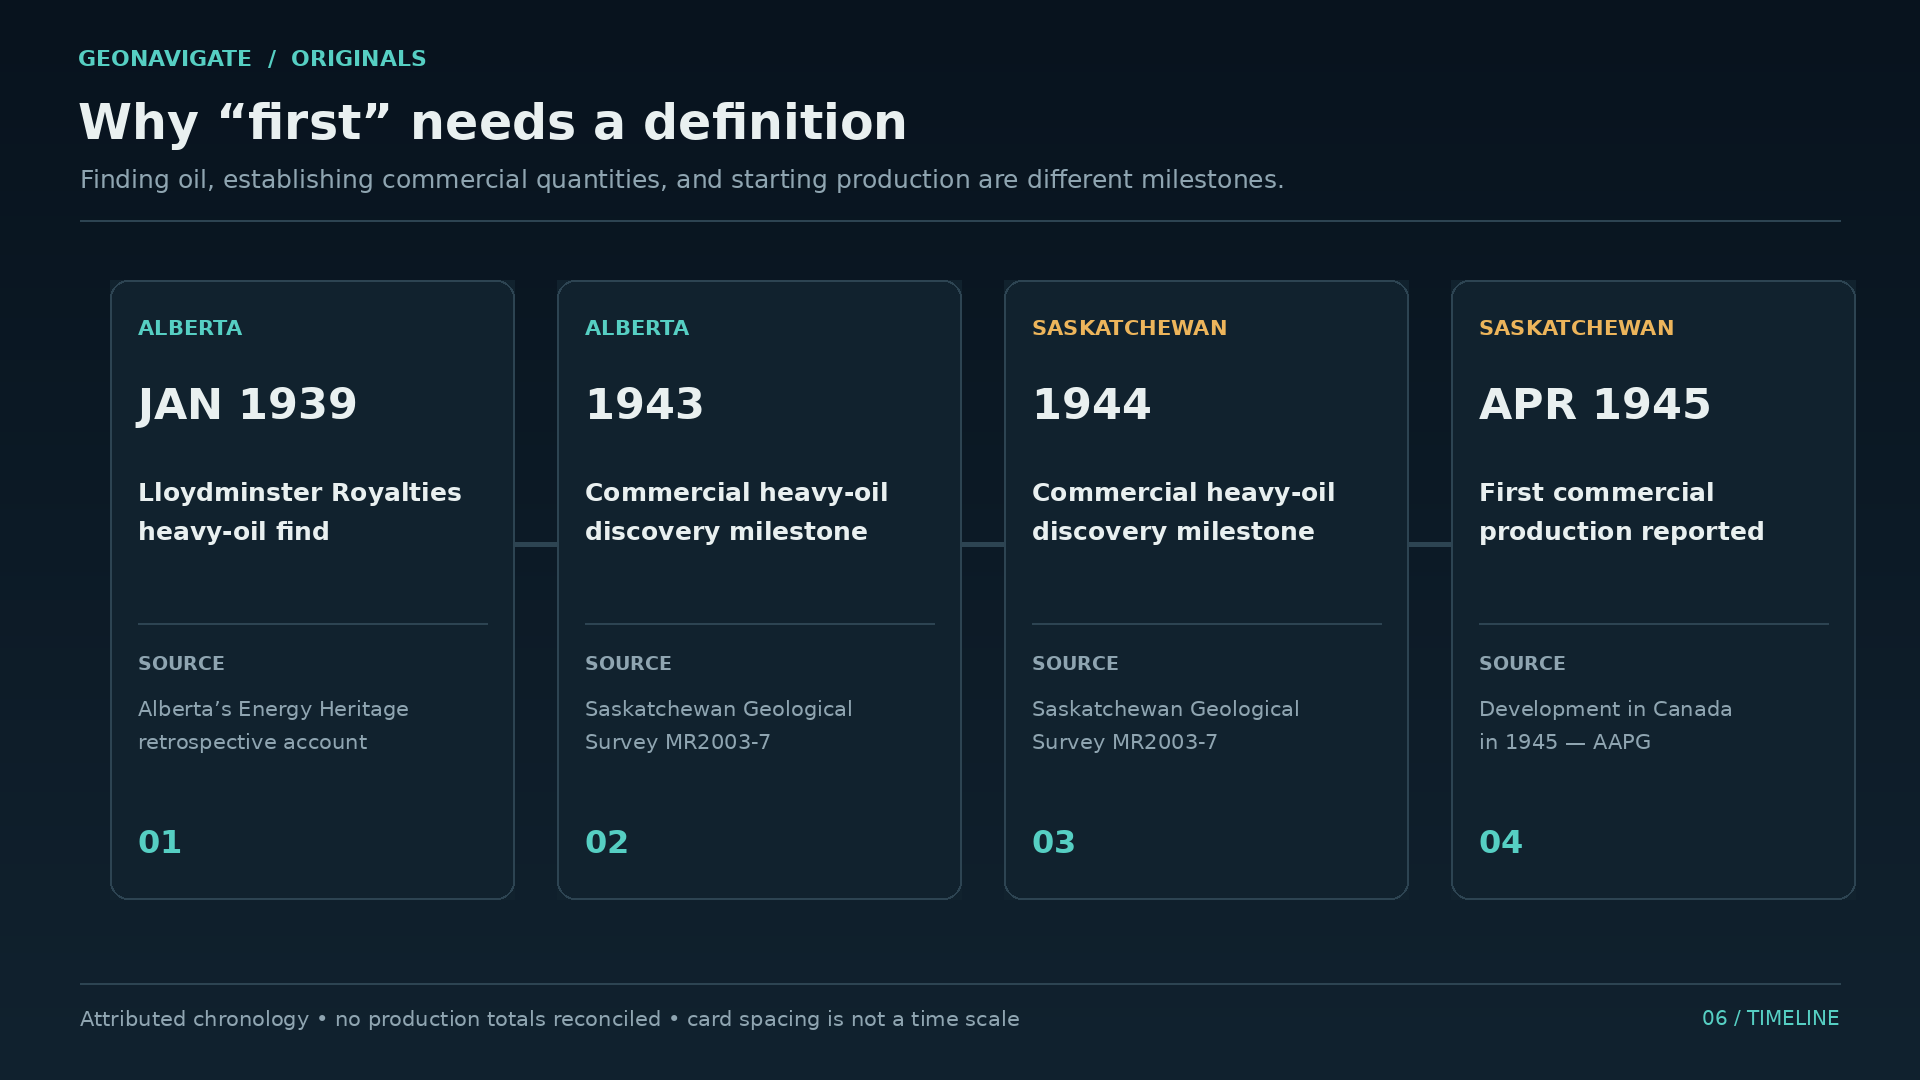
Start in the nineteen thirties. The Saskatchewan Geological Survey's historical review records oil found in the Lloydminster area in nineteen thirty five, without a commercially viable result at that point.
Alberta's Energy Heritage account then describes a January nineteen thirty nine find by Lloydminster Royalties Limited, southwest of town. The crude was heavy. Its existence was encouraging; the market for it remained limited.
Next come two dates that belong together. The Saskatchewan review places discoveries of commercial quantities of heavy crude in nineteen forty three on the Alberta side, and nineteen forty four on the Saskatchewan side. It identifies the producing interval as the Sparky sand of the Mannville succession.
Finally, a contemporary annual review published by the American Association of Petroleum Geologists gives April nineteen forty five as the start of production from Saskatchewan's first commercial oil well, in the Lloydminster field.
Those statements describe a progression. Evidence of oil comes first. A commercial discovery is a stronger assessment of what a reservoir might deliver. Production begins when a well actually starts contributing oil. Sustained performance then has to be demonstrated over time.
We should resist squeezing all of that into one anniversary. The nineteen thirty nine Alberta find, the nineteen forty four Saskatchewan discovery milestone, and the nineteen forty five production milestone each answer a different question. The sources also have different purposes: a later provincial history, an Alberta heritage account, and a technical review written close to the events.
For this episode, Saskatchewan's commercial discovery milestone is nineteen forty four. Its first commercial production is reported in April nineteen forty five. That wording preserves the distinction instead of asking a single date to carry the whole story.
A newspaper published that summer takes us closer to what the achievement felt like before the future was known.
CHAPTER 04
National Grant and the test of time
On August third, nineteen forty five, the Prince Albert Daily Herald reported a statement from Saskatchewan resources minister J. L. Phelps. The report named National Grant Number One, five miles south of Lloydminster, as the province's first commercial oil well to be put on pump.
The same article carried a revealing qualification. The first commercial well still needed to demonstrate its performance over the long term.
That is a remarkably useful sentence to find in a story of beginnings. We tend to read history backwards, with the later industry already visible. The people reading that newspaper had no such assurance. They had a producing well and reasons for interest. They also had a result that needed time.
An oil sample answers a limited question: petroleum is present. A production test asks more. Can it move into the well? At what rate, under what conditions? A production history adds another dimension: does that behaviour continue, and what changes as fluid is withdrawn?
Imagine the difference between one full container and a sequence of dated measurements. The container makes a powerful photograph. The measurements begin to explain whether the achievement can be repeated.
For the next part of the story, carry that caution underground. A well can intersect oil and still face a difficult reservoir. To see why, we need to reconstruct the landscape that made the sand.
CHAPTER 05
The landscape inside the rock
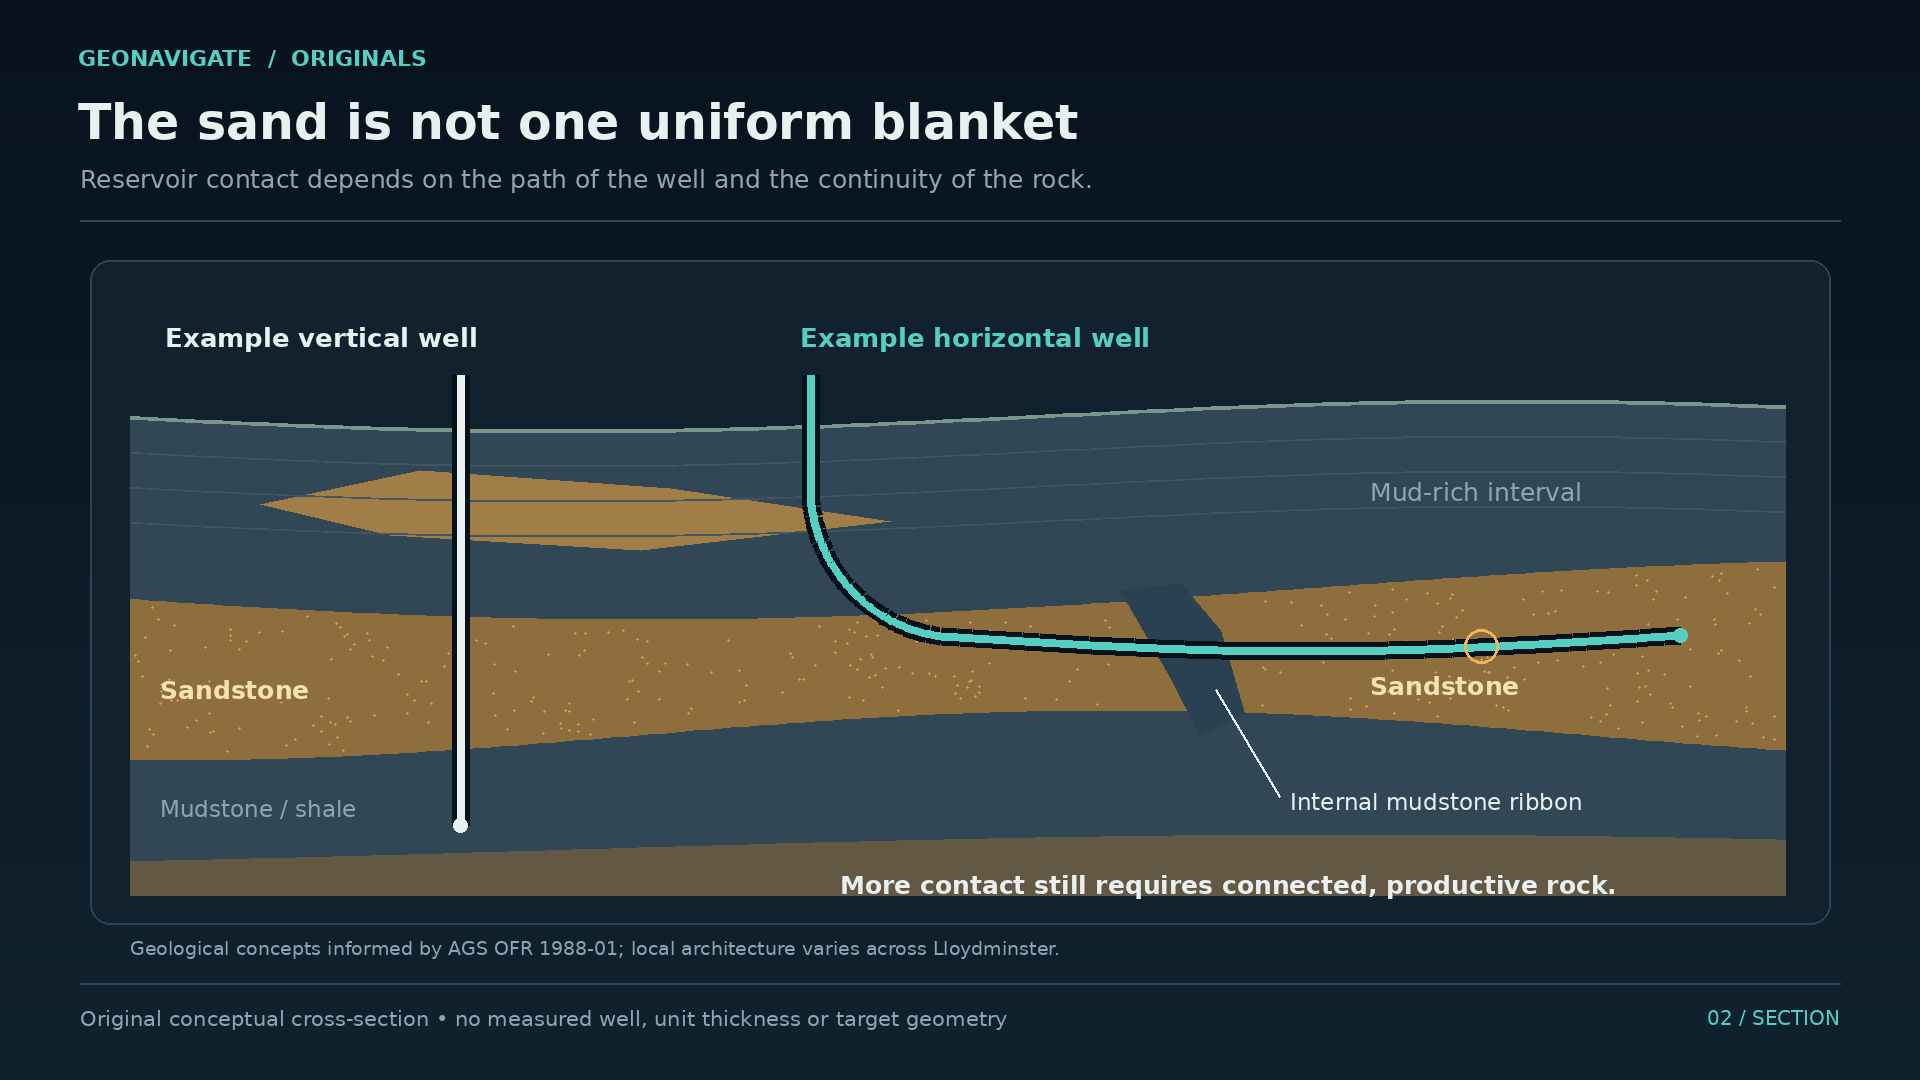
The Mannville is a Cretaceous succession, part of the sedimentary record beneath a large area of Western Canada. Its deposits accumulated after a long interval of erosion had shaped the older rocks below. That older surface had relief: low areas, higher areas, and routes that influenced where later sediment collected.
Now replace the modern prairie in your mind with shifting shorelines and waterways. Sand moves with currents. Mud settles where conditions allow finer material to accumulate. A channel cuts into an older deposit and fills again. Over time, these environments move across one another, leaving a three dimensional arrangement buried beneath later sediment.
In the west central Lloydminster area, an Alberta Geological Survey study describes a shallow, partly enclosed brackish setting. Its deposits include tidal and estuarine sediment, shoreface sands, and channels associated with floodplain and swamp deposits. The study also emphasizes differences across the wider district. There was no single environment making an identical reservoir everywhere.
The Sparky name belongs within that layered history. It gives geologists a way to discuss an interval. It does not promise that every well entering that interval will encounter the same sand thickness, the same continuity, or the same fluid behaviour.
Think of a modern shoreline after repeated storms, or a river that has changed course. A flat map cannot show everything those processes leave behind. Some sand bodies spread relatively widely. Others form narrower pathways. Muddy layers can divide them or interrupt their connections.
When we draw a cross section, the colours are trying to summarize those relationships. The real task is to explain how the pieces connect in three dimensions. A successful well gives one observation within that larger puzzle. The next well may encounter a different part of the ancient landscape.
CHAPTER 06
Between two wells
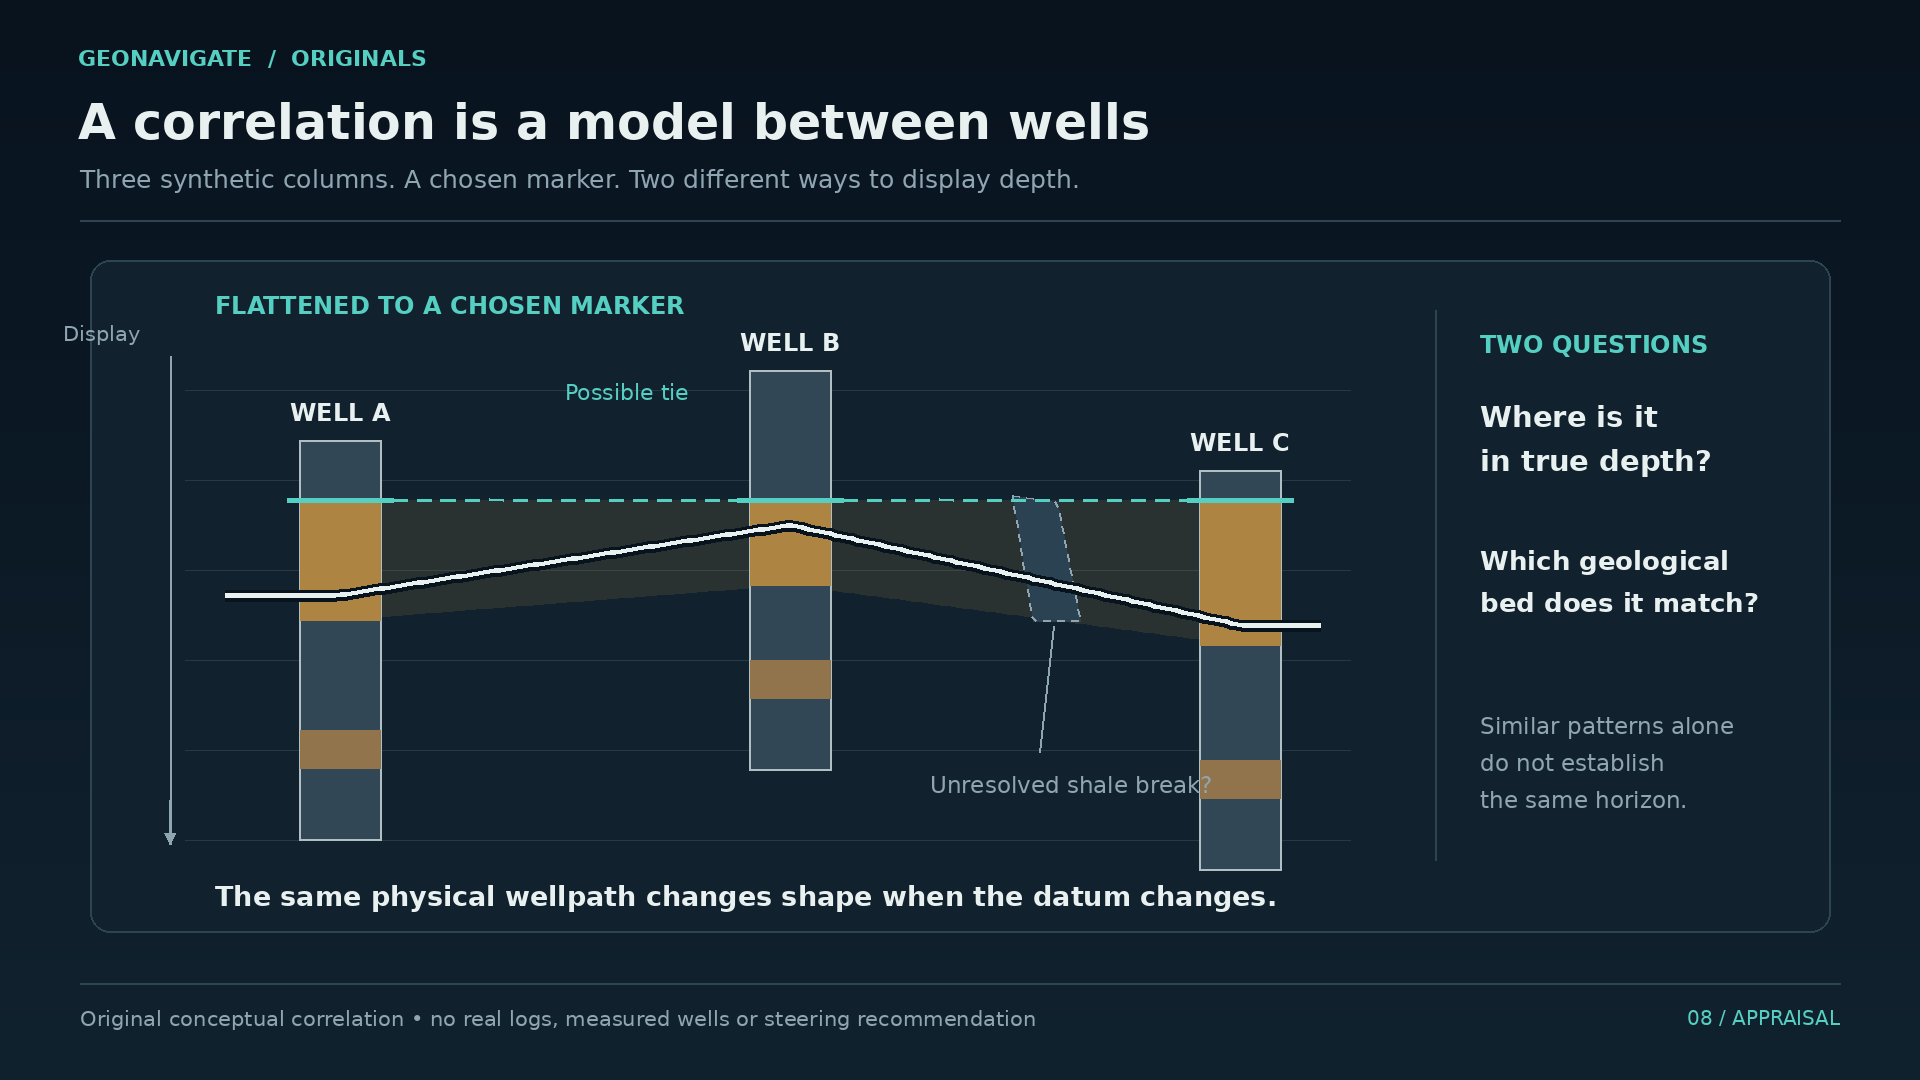
Put two well records beside one another. In each, there is a sandy interval between muddier beds. It is tempting to draw a straight line from the top of one sand to the top of the other and declare them connected.
That line is an interpretation. It needs evidence.
Well logs provide measurements along a borehole. Different tools respond to different properties, and the combined record helps geologists interpret what the well has penetrated. Core, where it is available, adds a direct sample of the rock. Neither turns the space between wells into an open window.
Suppose a third well encounters mostly mud where the first two found sand. Several explanations become possible. The sand may thin out. A channel may have removed part of it. The wells may occupy different parts of a depositional system. The correlation must account for that third observation, even if it spoils an attractive picture.
Research on Lloydminster's heavy oil reservoirs describes both more extensive sandy units and narrower bodies, with interruptions and internal variation. The practical implication is immediate: the distance between two wellheads tells us little unless we understand the rock between them.
Production behaviour adds another kind of evidence. Pressure and flow measurements can help test whether a geological interpretation also makes sense as a connected fluid system. A tidy cross section and a poorly performing well cannot simply be filed in separate drawers.
This is why development involves repeated revision. An interpretation guides a decision. The new well contributes information. That information changes the interpretation.
Our diagrams make that process visible by keeping uncertain connections uncertain. The question is not merely where the sand appears. It is whether oil can travel through enough of it to reach the well. To answer that, we have to move from beds and channels to the spaces between individual grains.
CHAPTER 07
Room to store, paths to flow
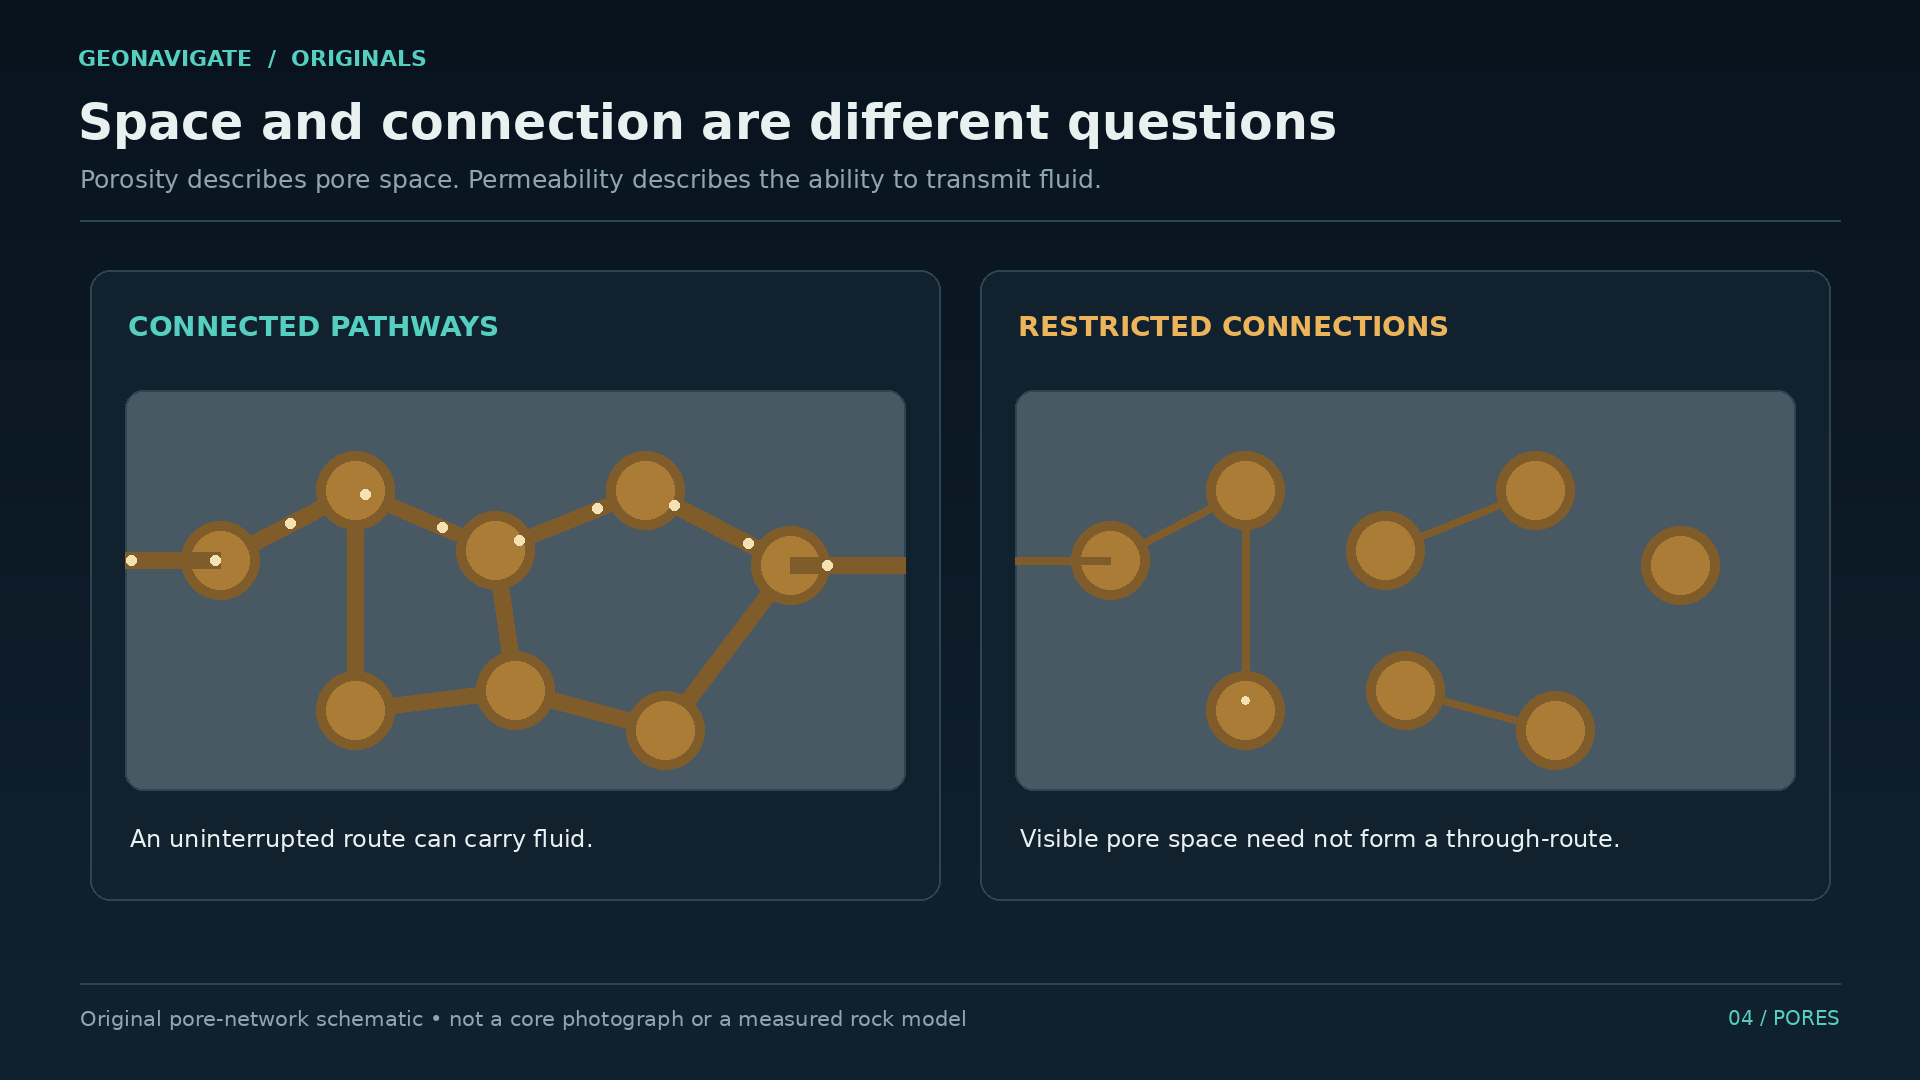
Take a small volume of reservoir rock. Some of that volume is solid mineral. Some is pore space. Porosity describes how much space is available within the rock.
That gives us somewhere to hold fluid. It does not yet tell us how easily fluid can move.
Permeability describes the rock's ability to transmit it. The connections matter: their dimensions, their continuity, and the routes they provide. Two samples can have a similar amount of pore space and behave very differently when fluid tries to pass through them.
Here is a useful imaginary comparison. Make two clear blocks, each containing the same total volume of small chambers. In the first, broad openings connect the chambers. In the second, many connections are narrow or absent. The available room looks comparable. The throughflow does not.
Real rock is far more irregular than those blocks, but the distinction holds. Counting empty space is different from describing a working network.
There is another question: what occupies the pores? Reservoir rock can contain oil, water, and gas. Saturation describes how the pore volume is shared among fluids. An estimate of pore space cannot simply be turned into an equal volume of oil.
Then comes recovery. Even the oil present in a reservoir is not automatically oil that a particular project can produce. Fluid properties, pressure, geological connections, and the chosen production method all enter the calculation.
This sequence keeps a large underground number in perspective. Rock volume leads to pore volume. Fluid occupancy tells us how much oil may be present. A separate assessment addresses what can be recovered.
For Lloydminster, the next complication sits inside that pore network. The fluid itself resists movement. You can have useful storage space and promising connections, yet still need to solve the problem of moving heavy oil through them.
CHAPTER 08
What heavy means
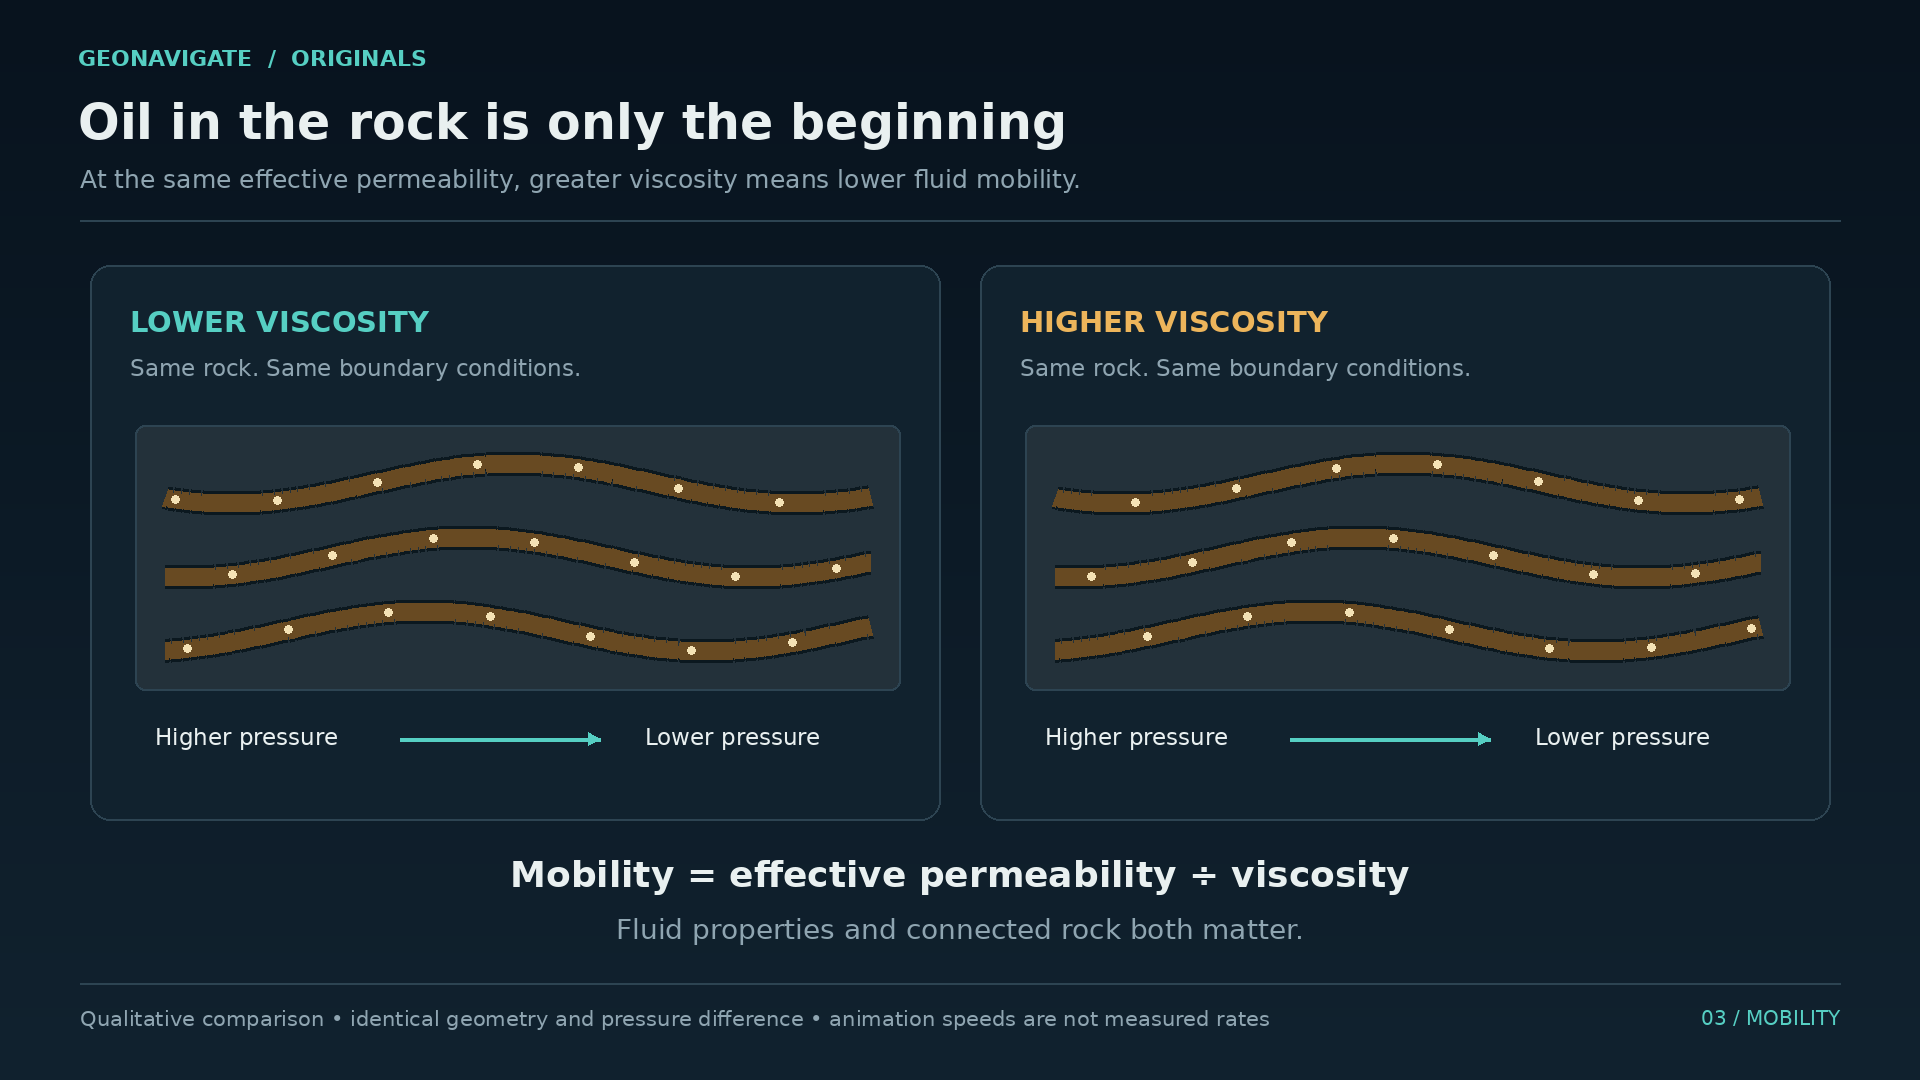
Heavy oil carries two ideas that are easy to blend together: density and viscosity.
Density describes mass in a given volume. Viscosity describes resistance to flow. They are different properties, and a useful reservoir description needs more than the word heavy.
For a familiar illustration, consider a thick syrup moving through a small opening. Change the opening and you change the resistance of the pathway. Warm the syrup and you change the fluid. Those are two different interventions, even though either may increase the amount moving through.
The illustration is qualitative. Syrup is not a substitute for measuring a reservoir fluid at reservoir conditions. Temperature matters, composition matters, and the oil below ground may behave differently from a sample that has cooled and lost gas at the surface.
Many heavy oils have also been altered during their geological history. Biodegradation can preferentially remove lighter components, leaving a denser, more viscous mixture. That is one reason the history of the fluid matters alongside the history of the sand holding it.
Now connect this to the rock. Under comparable conditions, an easier pathway favours flow. A more viscous fluid resists it. Pressure differences provide the drive. The combined behaviour determines whether oil can reach a producing well at a useful rate.
That gives us three different approaches to watch as the story moves forward. We can change pathways within the reservoir. We can place a well in contact with more reservoir. Or we can change fluid behaviour, for example by adding heat.
Each approach solves a different part of the problem and brings its own constraints. Lloydminster's history becomes much clearer once those ideas are separated. The first takes us back to a seemingly unwelcome visitor in an oil well: the sand itself.
CHAPTER 09
The sand paradox
An April nineteen forty six newspaper report from the Lloydminster field described a new well whose flow had stopped temporarily when sand blocked it. The obstruction was cleared. Whatever the well's later history, the incident captures an immediate operating problem: finding oil did not mean it would arrive at the surface without interruption.
Sand can obstruct flow and wear equipment. Yet decades later, deliberate sand production became central to an important heavy oil method.
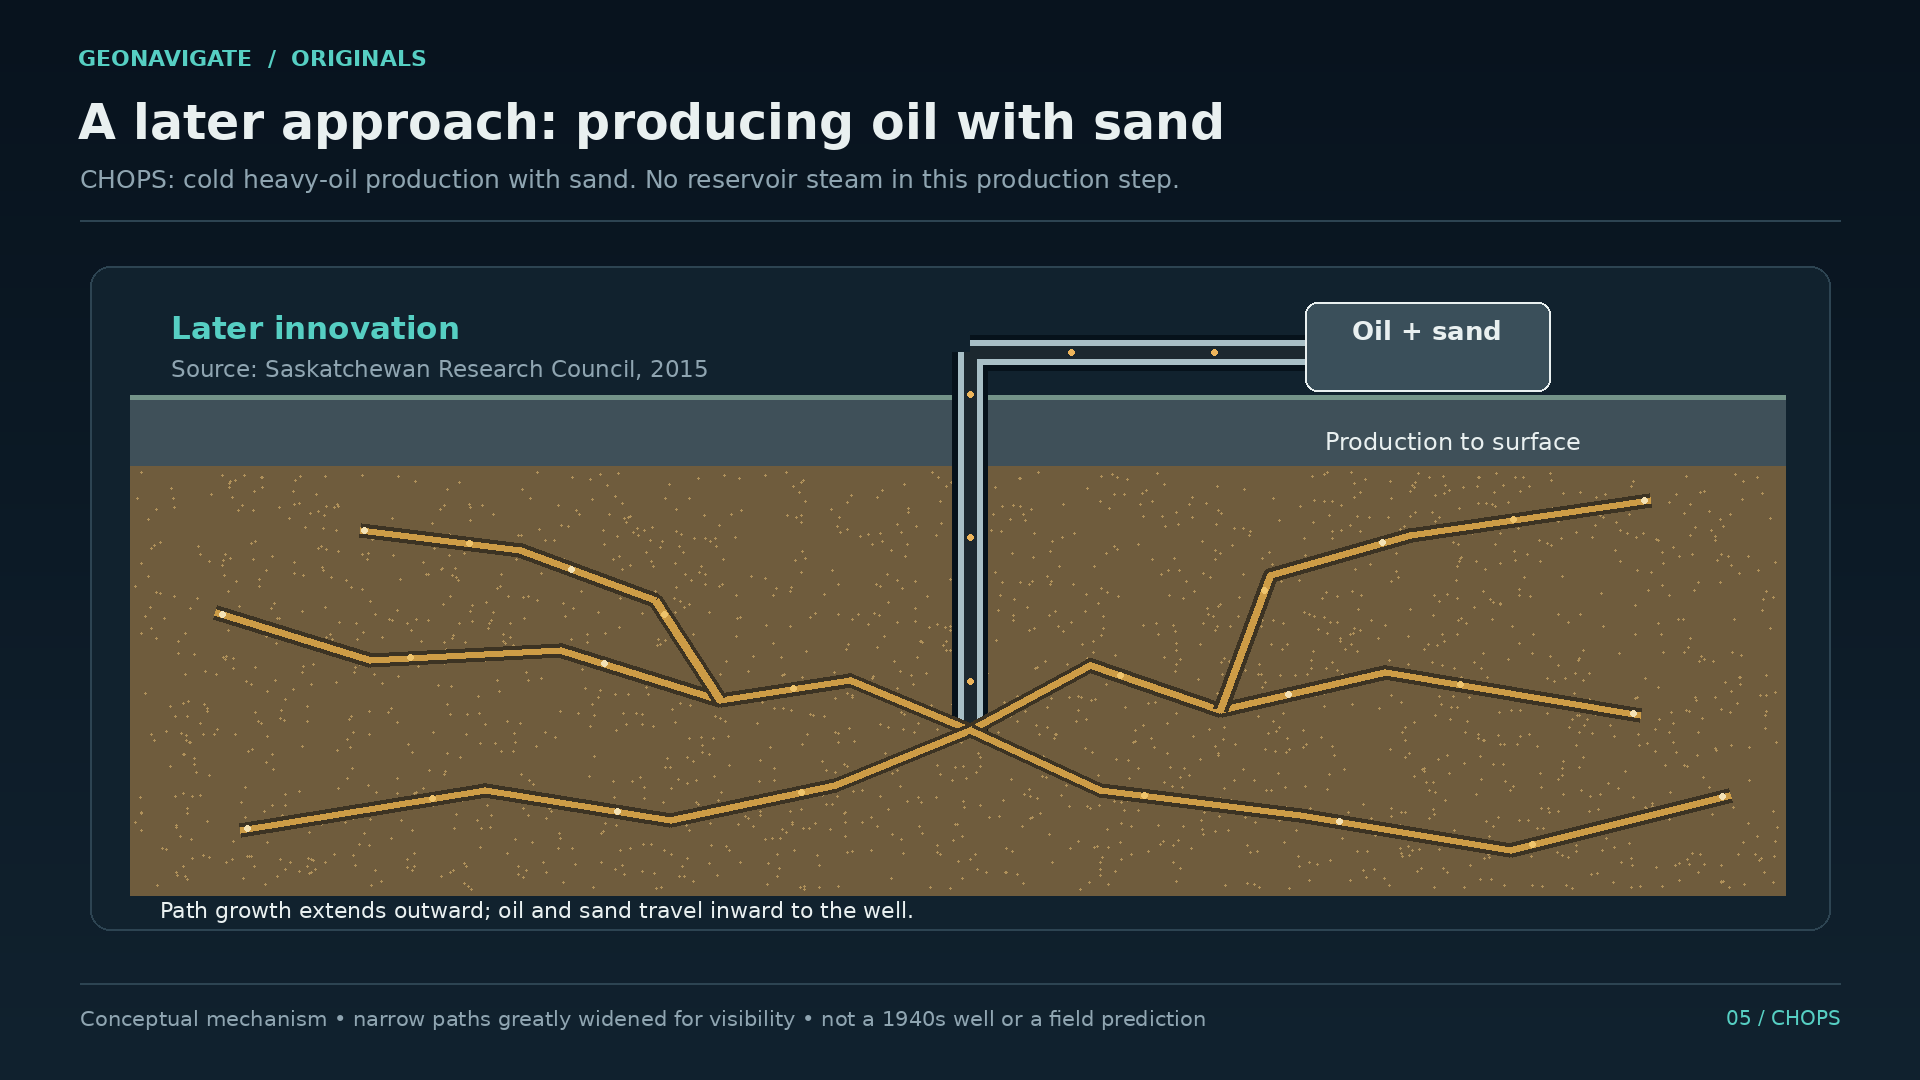
The name is CHOPS: cold heavy oil production with sand.
Cold means the recovery process does not depend on supplying heat to the reservoir. The sand is formation material produced along with the oil. It is not a delivery of sand injected to create the effect.
In suitable, loosely consolidated reservoirs, sand movement can develop preferential paths toward a producing well. These are commonly called wormholes. The Saskatchewan Research Council describes them as long, narrow features rather than large underground cavities.
In a diagram, we enlarge those paths so they can be seen. Their importance is the improved connection they can provide between reservoir fluid and the well. A branching shape in that drawing is not a surveyed tunnel system, and it is not the same thing as several branches drilled by a rig.
The paradox is practical. Material that can make production troublesome may, under suitable conditions, help create the paths that support production. But the benefit arrives with the material. Sand still reaches the well and the surface equipment, where it must be handled.
The nineteen forty six blockage was not evidence that this later method had already been developed. It belongs to the earlier struggle with the same material. CHOPS required a production system able to work with the mixture coming out. An important part of that system was a different kind of pump.
CHAPTER 10
Inside the pump
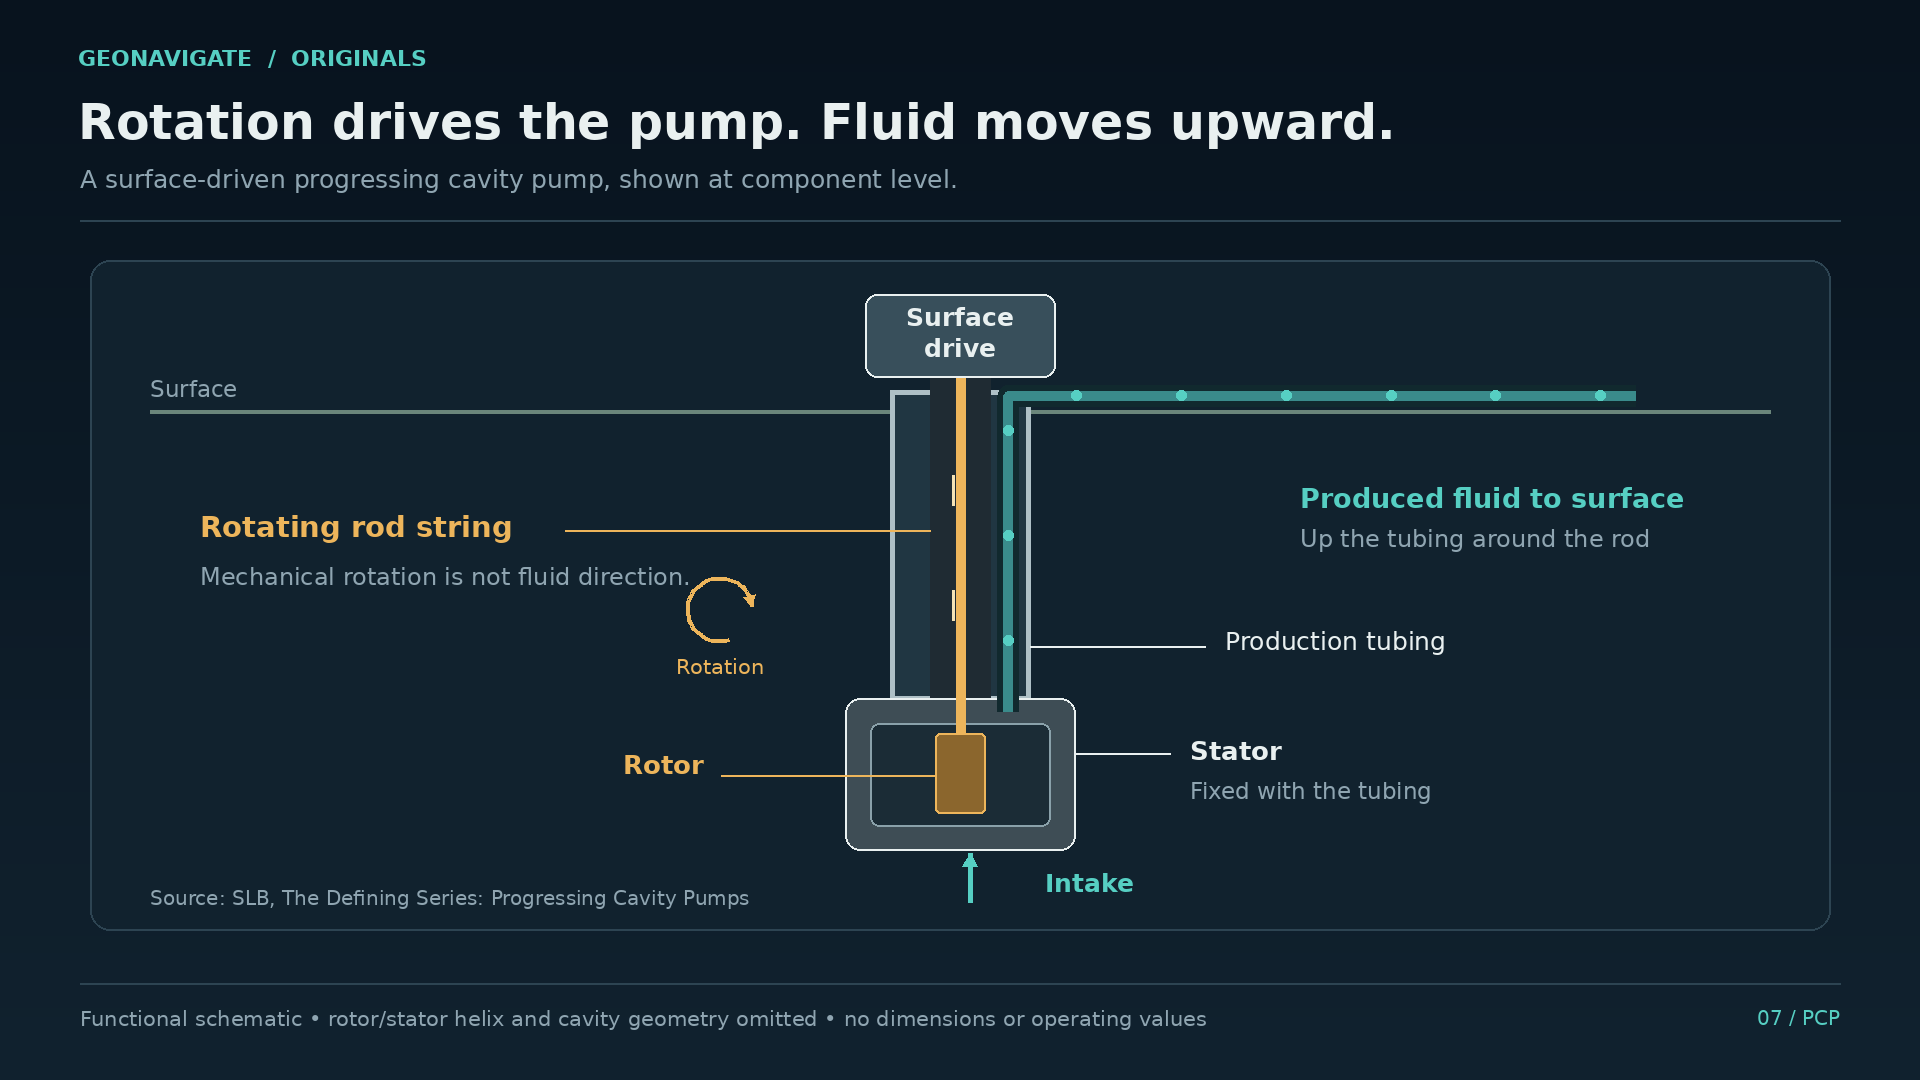
Look below a compact surface drive and down the well. In a common arrangement, a motor turns a rod string connected to a helical rotor inside a stator. Together, the rotor and stator form a progressing cavity pump, usually shortened to PCP.
As the rotor turns, a sequence of cavities carries fluid through the pump. It is a positive displacement process. The geometry matters because the moving cavities do the work of transporting the mixture.
PCPs are useful for viscous fluids and can be designed to handle significant solids. That capability helped make them important in heavy oil production. They still have operating limits. Materials, temperature, gas content, abrasive wear, and the well's geometry affect how a system performs.
Hold that cutaway in mind and then widen the view. The pump is only one part of the route. Oil must first move through the reservoir and enter the well. The pump then supplies lift. Above it, tubing and surface equipment must accommodate what arrives.
A capable pump cannot manufacture a connected reservoir. And a promising reservoir cannot deliver its potential through equipment poorly suited to the produced mixture. The system has to work from one end to the other.
We can understand that without choosing a motor size or prescribing a pump speed. The documentary question is why this type of hardware mattered: it offered a way of moving a difficult, changing mixture rather than treating every grain of produced sand as an impossible condition.
That brings the story out of the well. Follow the flow to the surface and the label oil production starts to look incomplete. What arrives may include oil, water, gas, and solids, each demanding attention before the useful product can move onward.
CHAPTER 11
What comes up with the oil
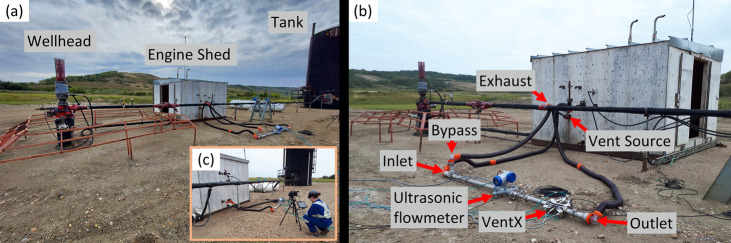
At the surface, separate the idea of a barrel sold from the larger stream that had to be handled to obtain it.
Water needs its own handling system. Sand creates a solids stream. Gas can separate from the oil as pressure and temperature conditions change. Equipment and measurements have to account for that changing mixture.
An original schematic can make the sequence look wonderfully orderly: one inlet, several outlets, neat arrows. A real production system has changing rates and compositions, maintenance requirements, and decisions about where each stream goes next.
Canadian Natural's description of its primary heavy oil operations near Lloydminster and Bonnyville specifically includes centralized treating and sand handling facilities. That is a useful reminder that reservoir technology depends on facilities beyond the wellhead.
There is also a subsurface aftermath. CHOPS can improve access to oil while leaving substantial oil behind. The Saskatchewan Research Council's work on reservoirs after CHOPS describes depleted solution gas and a network of preferential channels remaining in the formation.
Those channels become part of the starting conditions for any later recovery method. A fluid introduced afterwards may follow an easy route while contacting less of the oil elsewhere. Research therefore considers how to control flow through and around those paths, or make constructive use of them.
The reservoir has acquired a production history. A later project inherits it. That history includes what has been removed, the pressure changes, and the pathways created along the way.
Above ground, there is an equally important inheritance: roads, gathering systems, processing equipment, and customers. A discovery becomes a durable industry when those connections begin to work together. Lloydminster provides a particularly tangible example: a refinery that arrived from another country.
CHAPTER 12
A market arrives by way of Wyoming
The early Alberta heritage account identifies a problem that a map of oil discoveries can easily miss. Heavy crude had limited markets. Canadian National's use of oil for locomotives helped provide an outlet.
That connection changes how we read an early well. A reservoir can be promising while its product remains difficult to sell or move. The customer and the transport link become part of the practical meaning of commercial.
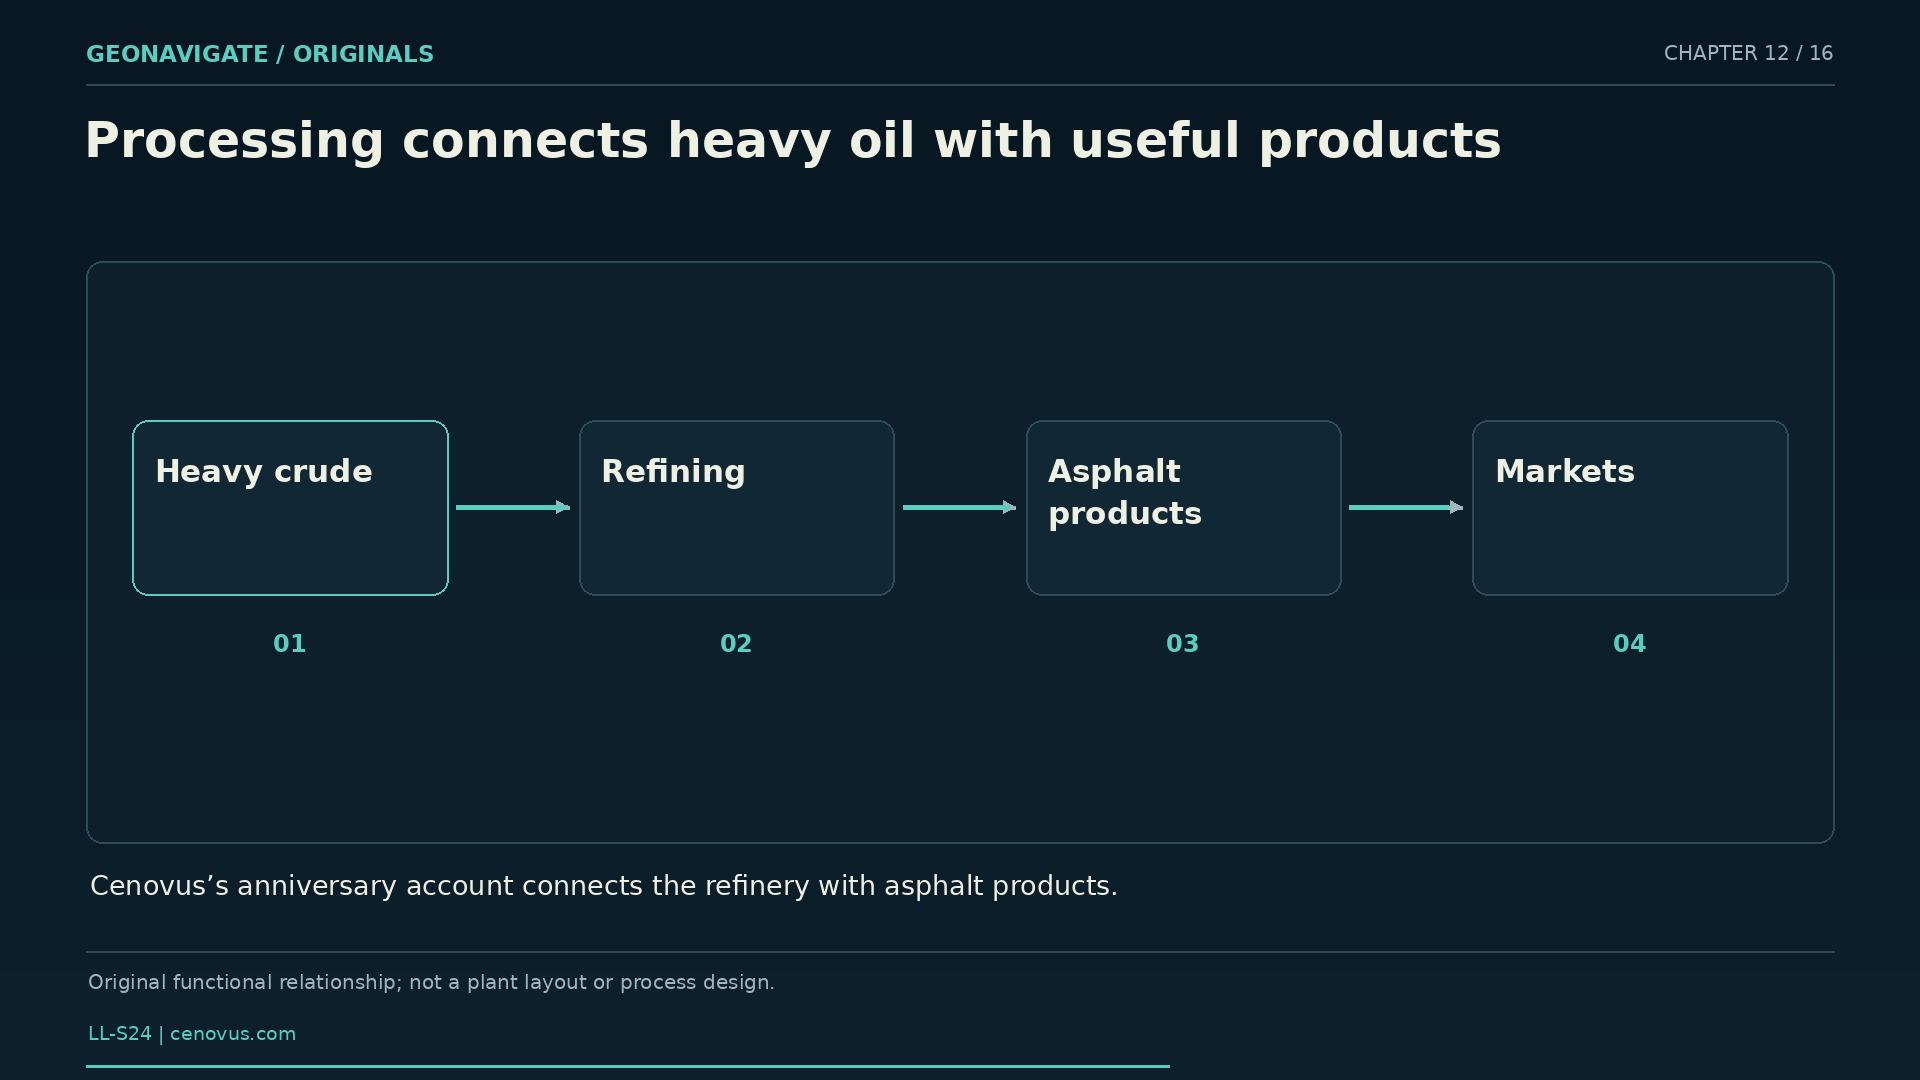
Then comes a striking piece of industrial history. Cenovus records that the refinery was moved from Riverton, Wyoming, to Lloydminster in nineteen forty six. It began operating there in nineteen forty seven.
A refinery relocation is a different sort of discovery story. The oil was already underground. What changed was the equipment available to turn that resource into useful products closer to the producing district.
The Lloydminster refinery became associated with asphalt. In its account of the facility's seventy fifth anniversary, Cenovus described a range of asphalt products made from heavy oil. That provides an everyday connection between a difficult crude and a familiar material: the binder used in paved surfaces.
A second facility belongs to a much later chapter. The Lloydminster upgrader started in nineteen ninety two. The refinery and the upgrader have different roles, and their dates should stay separate.
Upgrading changes heavy feedstock into a lighter synthetic crude through processes that alter its composition. Refining separates and processes feedstocks into usable products. The details depend on the facility; one industrial silhouette should never stand in for every step.
Together, these developments broaden the story beyond the drill bit. Geology established the opportunity. Facilities, transport, customers, and skilled work gave that opportunity a practical route outward.
By this point, the question has expanded from whether a well can produce to how an entire system performs. Underground, that same expansion encouraged another approach: put more of the well in contact with the reservoir.
CHAPTER 13
Following the sand sideways
A vertical well passes through a reservoir interval. A horizontal well can remain within it for a longer distance. A multilateral design adds branches, potentially contacting additional parts of the reservoir from a connected well system.
The attraction is easy to see in cross section. A longer section of well within useful rock creates more opportunity for fluid to enter. That is a different mechanism from relying on sand movement to develop preferential paths.
Canadian Natural describes horizontal multilateral drilling as a principal development method in its primary heavy oil operations. Cenovus also reports a mix of methods in its conventional heavy oil activities. Those descriptions matter because they prevent a historical account of CHOPS from freezing the modern district in a single technological era.
Now complicate the attractive drawing. Let the sand thin. Place a muddy interruption along the route. Introduce water-bearing rock near part of the planned well. More drilled length is useful only if the well encounters conditions that support the intended result.
A lateral has a direction and an elevation. The reservoir has its own geometry, inherited from deposition and altered by later history. Keeping the two aligned requires interpretation, measurements, and adjustment.
The earlier correlation exercise returns with practical consequences. If the connection between two sand bodies is wrong, a beautifully drawn well path may cross the wrong rock. If fluid conditions differ along that path, different sections may contribute very different amounts.
There is no universal drawing that chooses the answer for every pool. A development plan has to fit the reservoir, its existing wells, and its production history.
Another option changes something more fundamental than well contact. Instead of asking a cold fluid to move through a better route, a thermal process supplies heat so the fluid becomes easier to move.
CHAPTER 14
A different route through heat
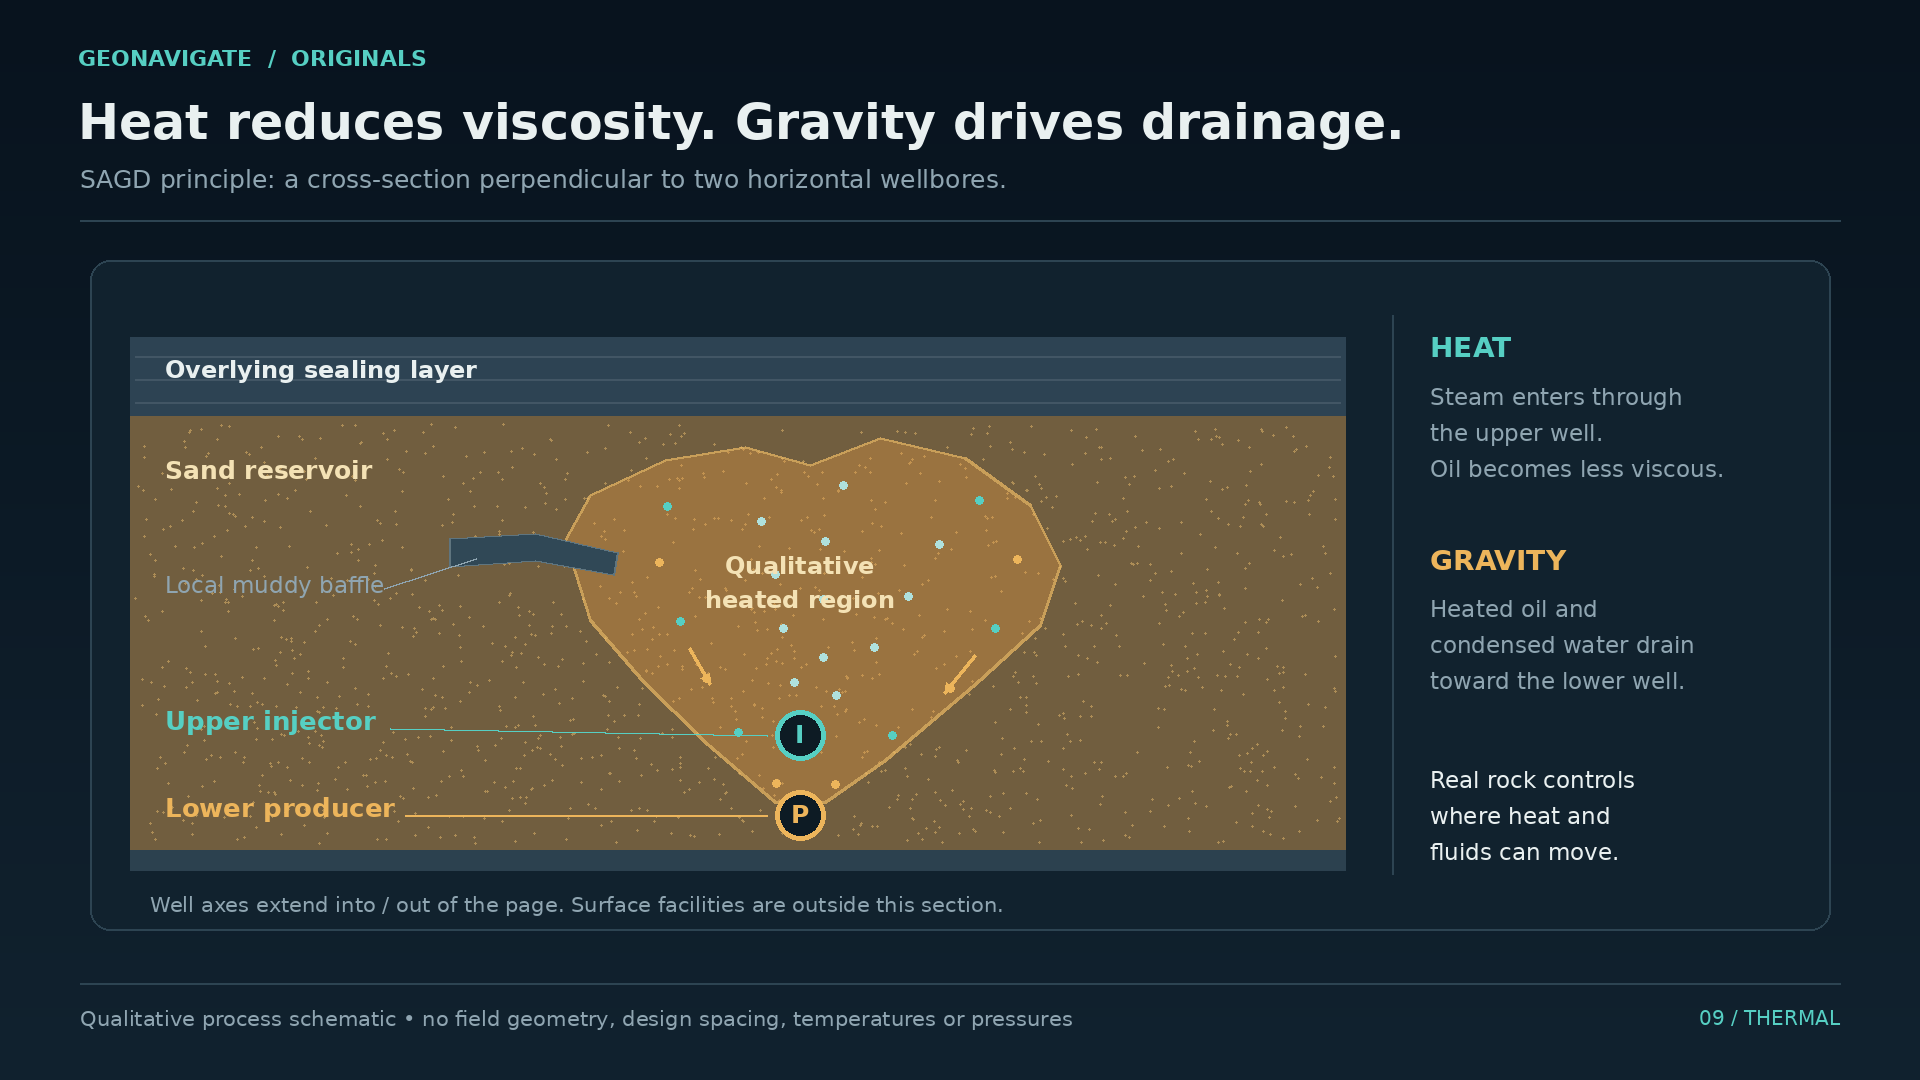
Heavy oil viscosity is strongly affected by temperature. Heating can make the oil more mobile. That basic property underlies several thermal recovery methods.
One is steam assisted gravity drainage, usually called SAGD. In its familiar arrangement, two horizontal wells sit one above the other. Steam supplied through the upper well heats a region of the reservoir. Mobilized oil and condensed water drain toward the lower producing well.
The picture is simple enough to understand. The project is a combined geological and industrial undertaking. Steam must be generated and delivered. Water and heat have to be managed. Produced fluids must be handled at the surface.
The reservoir also has to accommodate the process. The distribution of sand and muddy layers influences where heat and fluids move. A diagram with a smooth, symmetrical heated region is an explanation of the principle, not a promise of identical behaviour in real rock.
Cenovus describes thermal production as part of its Lloydminster-area operations. That belongs alongside conventional production in the regional story. It should not turn every historical well, or every heavy oil pool, into an assumed candidate for the same thermal design.
We can now compare the mechanisms clearly. A horizontal well increases contact with the reservoir. Sand production can alter pathways around a CHOPS well. Heat changes the mobility of the fluid. A project may combine ideas, but the differences remain important.
They also change what needs measuring. The amount of oil produced is one result. Energy use, water handling, gas, solids, and the performance of the facilities describe other parts of the system.
The next question, then, is how confidently we know what that system is doing. Here the modern industry returns to a concern already present in the nineteen forty five newspaper: performance has to be demonstrated.
CHAPTER 15
The evidence keeps arriving
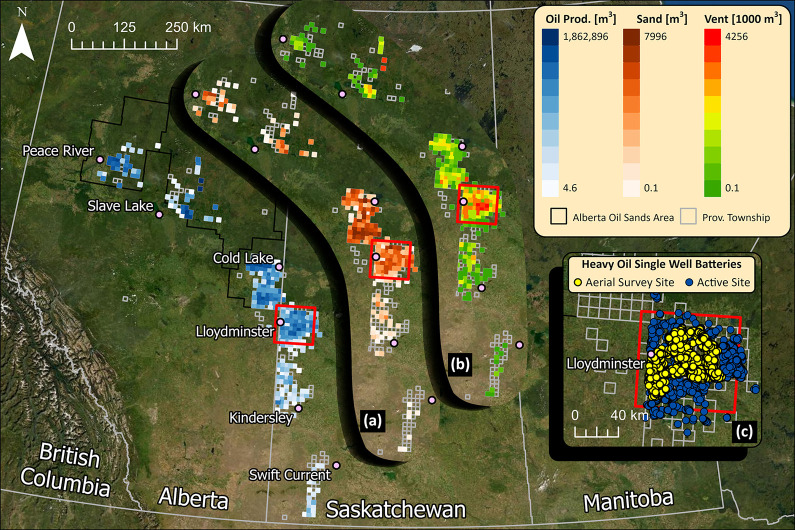
A production site can look quiet from a distance. That appearance tells us little about the quantities moving through it.
In a study published in twenty twenty three, researchers examined methane emissions from CHOPS facilities in Saskatchewan near Lloydminster. Their work combined aerial measurements over hundreds of sites with detailed ground measurements at selected facilities. They found substantial underreporting in the emissions they studied.
That is a dated measurement result from a defined population of sites. It is not a measurement of every present-day operation. Its relevance here is the difference between an assumed quantity and a quantity investigated directly.
Methane itself is invisible to ordinary vision. A photograph of a facility cannot settle the question. Nor can a generic emissions factor tell us everything about an individual operating site. Measurement methods, conditions, and coverage all matter when interpreting a result.
The same discipline applies underground. A reservoir model is built from observations and assumptions. As pressure and production records accumulate, engineers compare the model with what happened and revise it. The aim is to make the interpretation answer to the evidence.
There is a human consequence to this habit. Operators, nearby communities, and decision makers need dependable information about what is produced, what is handled, and what is released. Technical progress includes improving the quality of those answers.
Return for a moment to the empty space between two wells in our correlation diagram. It began as an uncertainty. Each new observation reduced some uncertainty and sometimes exposed another. The history of a producing district follows that same pattern on a much larger scale.
A first well opens the investigation. Years of operation supply the record. Better equipment and better measurements keep changing what can be learned from it.
CHAPTER 16
What first can mean
We can now answer the opening question with a little more precision.
The Saskatchewan Geological Survey's historical review places the commercial heavy oil discovery milestone on the Saskatchewan side of Lloydminster in nineteen forty four. The contemporary annual technical review places the start of the province's commercial oil production in April nineteen forty five.
That summer, National Grant Number One appeared in the newspaper as a well on pump, with its longer-term performance still to be established. The qualification makes the achievement more interesting. It lets us see a beginning while it was still uncertain.
What followed required several kinds of understanding. Geologists had to reconstruct sands deposited by changing waterways and shorelines. Engineers had to work with viscous fluids and a reservoir that could produce its own grains. Pump and facility design had to accommodate the mixture. Transport and processing had to connect it with a market.
The refinery's nineteen forty seven opening and the upgrader's nineteen ninety two start belong to that longer development. Later recovery methods added further choices, each shaped by the geology and by the history of the reservoir already in place.
Back at the provincial boundary, the street remains an ordinary part of a working city. The line helps organize the historical record. Below it lies a much older arrangement of sand, mud, and fluid, indifferent to the names above.
The discovery date marks an achievement. The decades that follow explain what it took to make that achievement useful, repeatable, and better understood.
This has been GeoNavigate Industry Chatter, with AI narration by Dorian. Thanks for listening.