Skip to content
Chaser Geological

Drilling history / GEONAVIGATE INDUSTRY CHATTER

Oil Beneath Home: Wapella, Moosomin and the Horizontal Question

Explore Wapella and Moosomin’s 1952 commercial oil discoveries, actual core evidence, dated well production and the conditions that could help or limit a horizontal well. The story continues toward Walpole and Wawota, where several distinct reservoir systems demand their own geological explanation.

Recorded20:56 · measured recordingAI narration: Dorian

Prepared

THE ILLUSTRATED EPISODE

Watch the full episode

20:56 · 1080p · English captions

Published core photographs, historical documents and well-log excerpts, dated well and production maps, original geological diagrams and three conceptual animations. The prairie-drilling illustration is labelled AI-created and does not portray a verified named well. Modern scenery is identified separately. Music is an original generated instrumental score. AI narration: Dorian.

THE RECORDING20:56 measured duration

CHAPTER 01

Oil beneath home
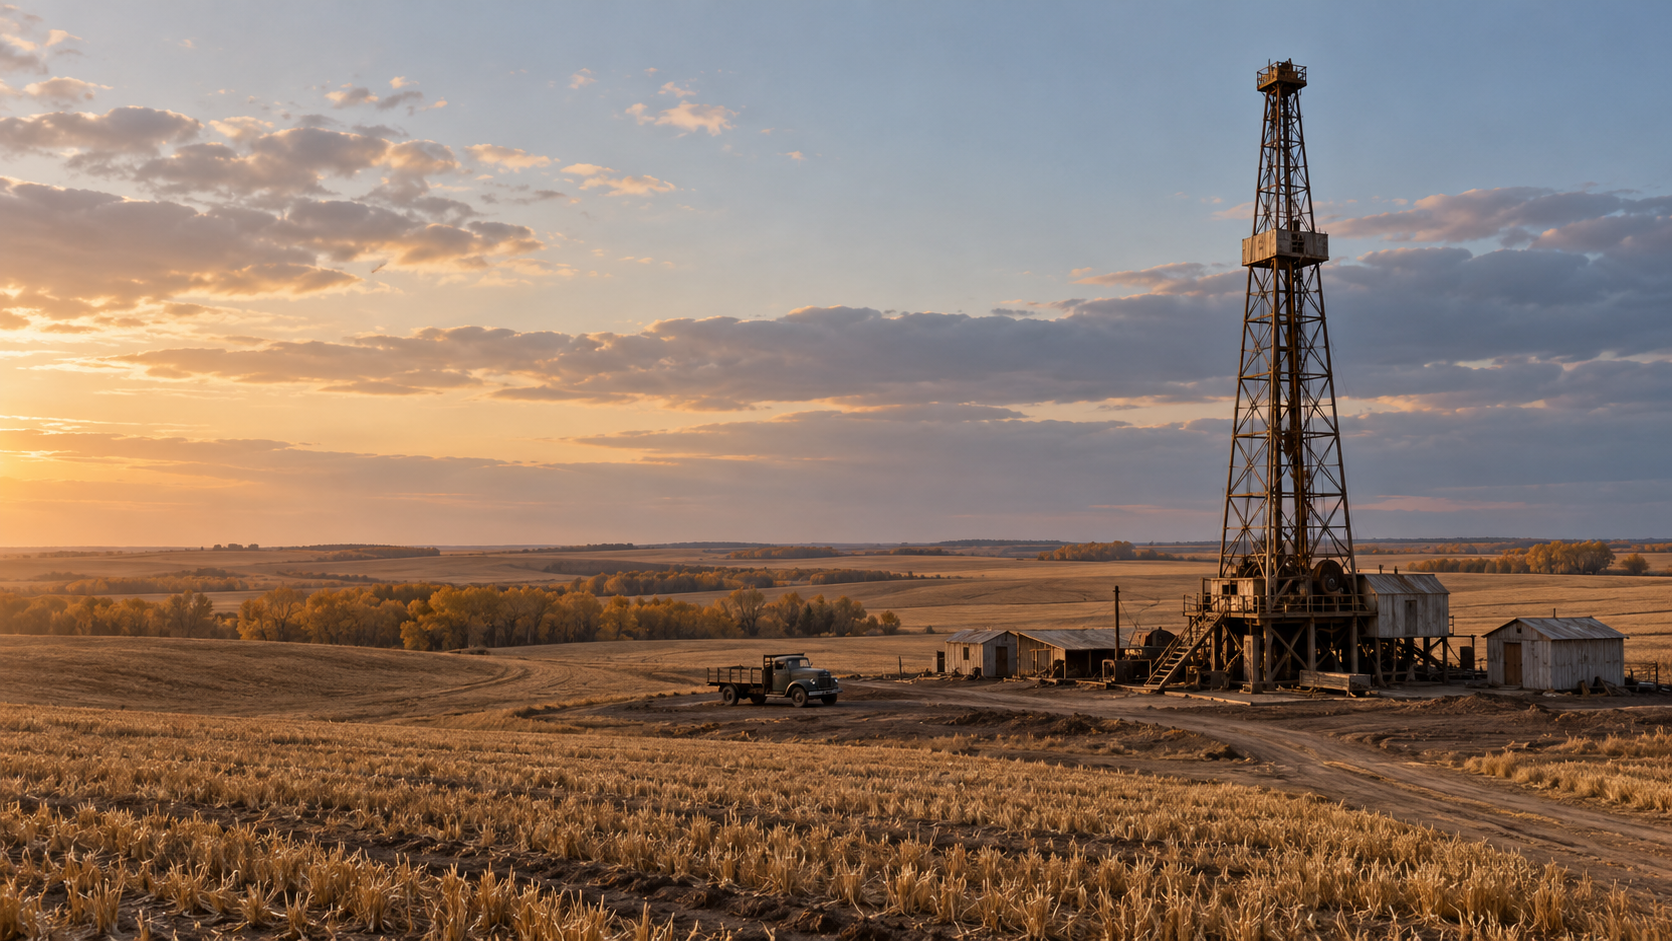
AI illustration of a generic 1950s prairie drilling rig beside farmland; no named historical well is reconstructed.
AI reconstructionAI-created illustration of generic 1950s prairie drilling, prepared for this episode. It is not an archival photograph, a verified recreation of a named Wapella well, or an engineering reconstruction.GeoNavigate; AI-generated illustration. · Original generated illustration prepared for GeoNavigate.
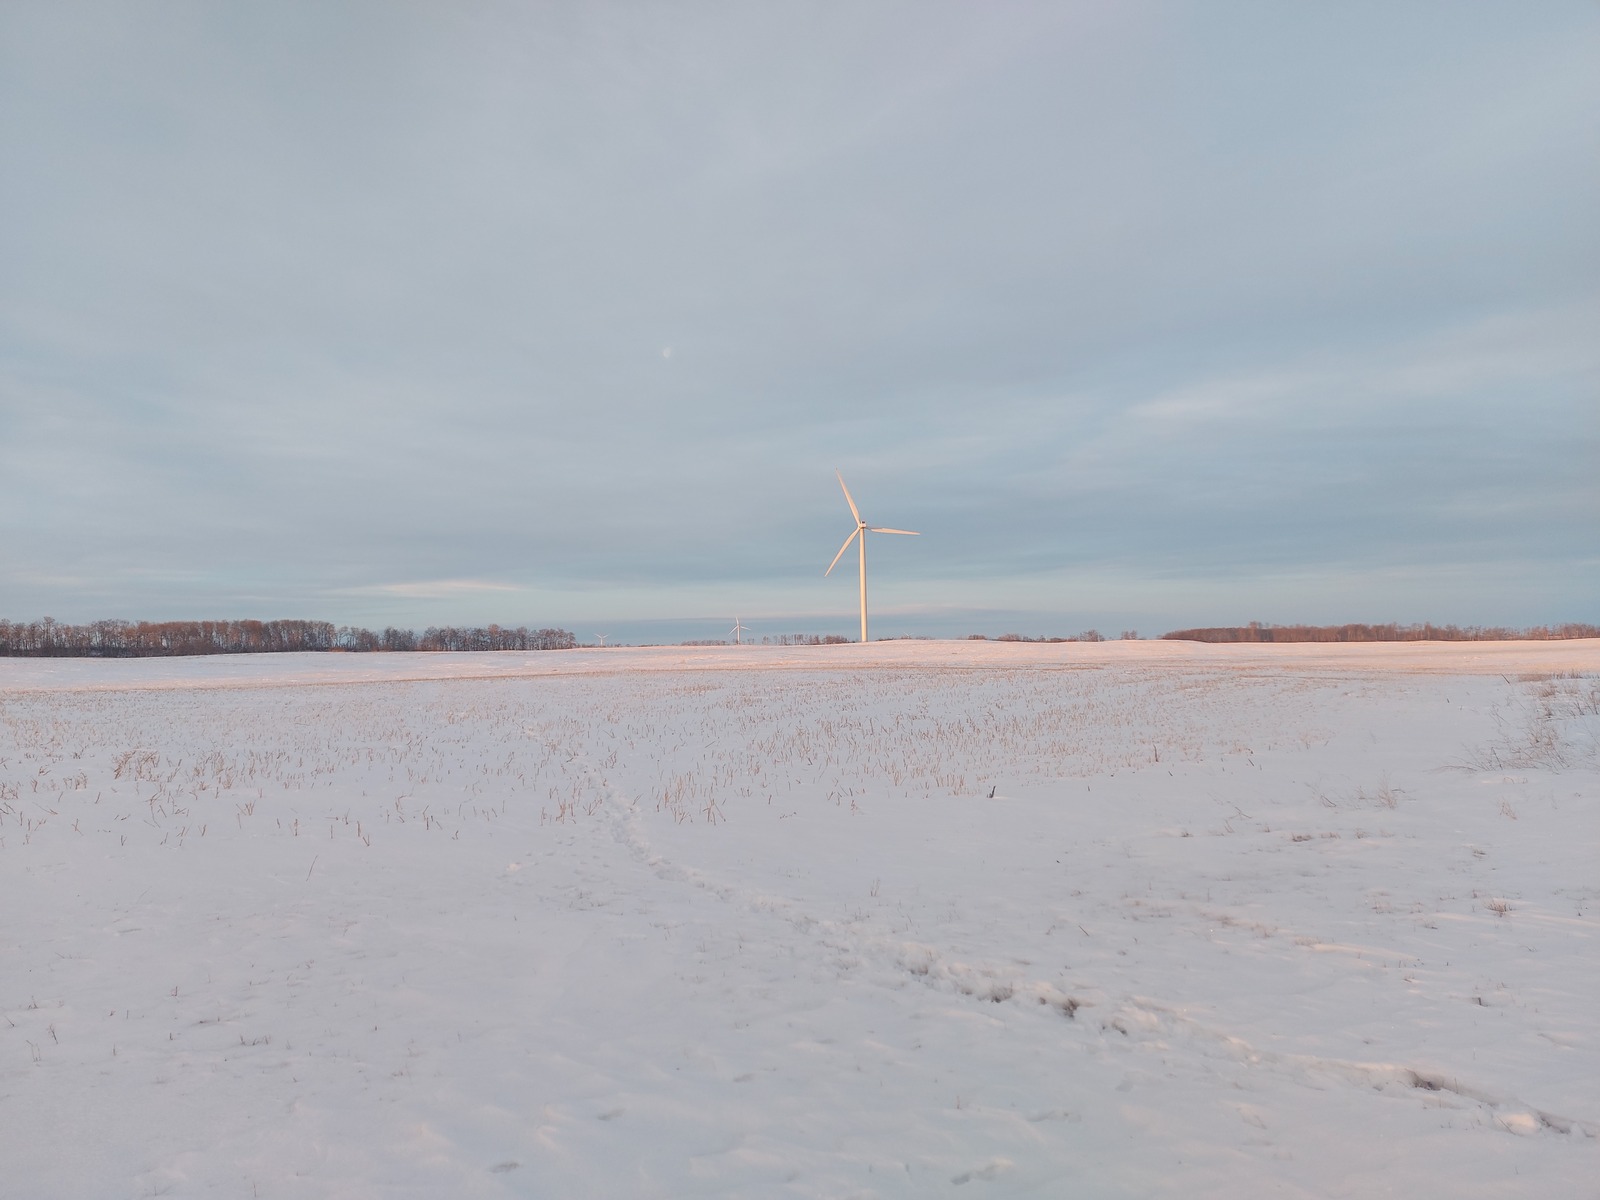
Modern prairie landscape and wind turbines near Moosomin.
Modern photographRed Lily Wind Farm, Moosomin, photographed on 30 January 2024. This provides present-day landscape context; it does not depict the 1952 discoveries or a historical wellsite.Masterhatch / Wikimedia Commons · CC0 · Image record ↗ · Licence ↗
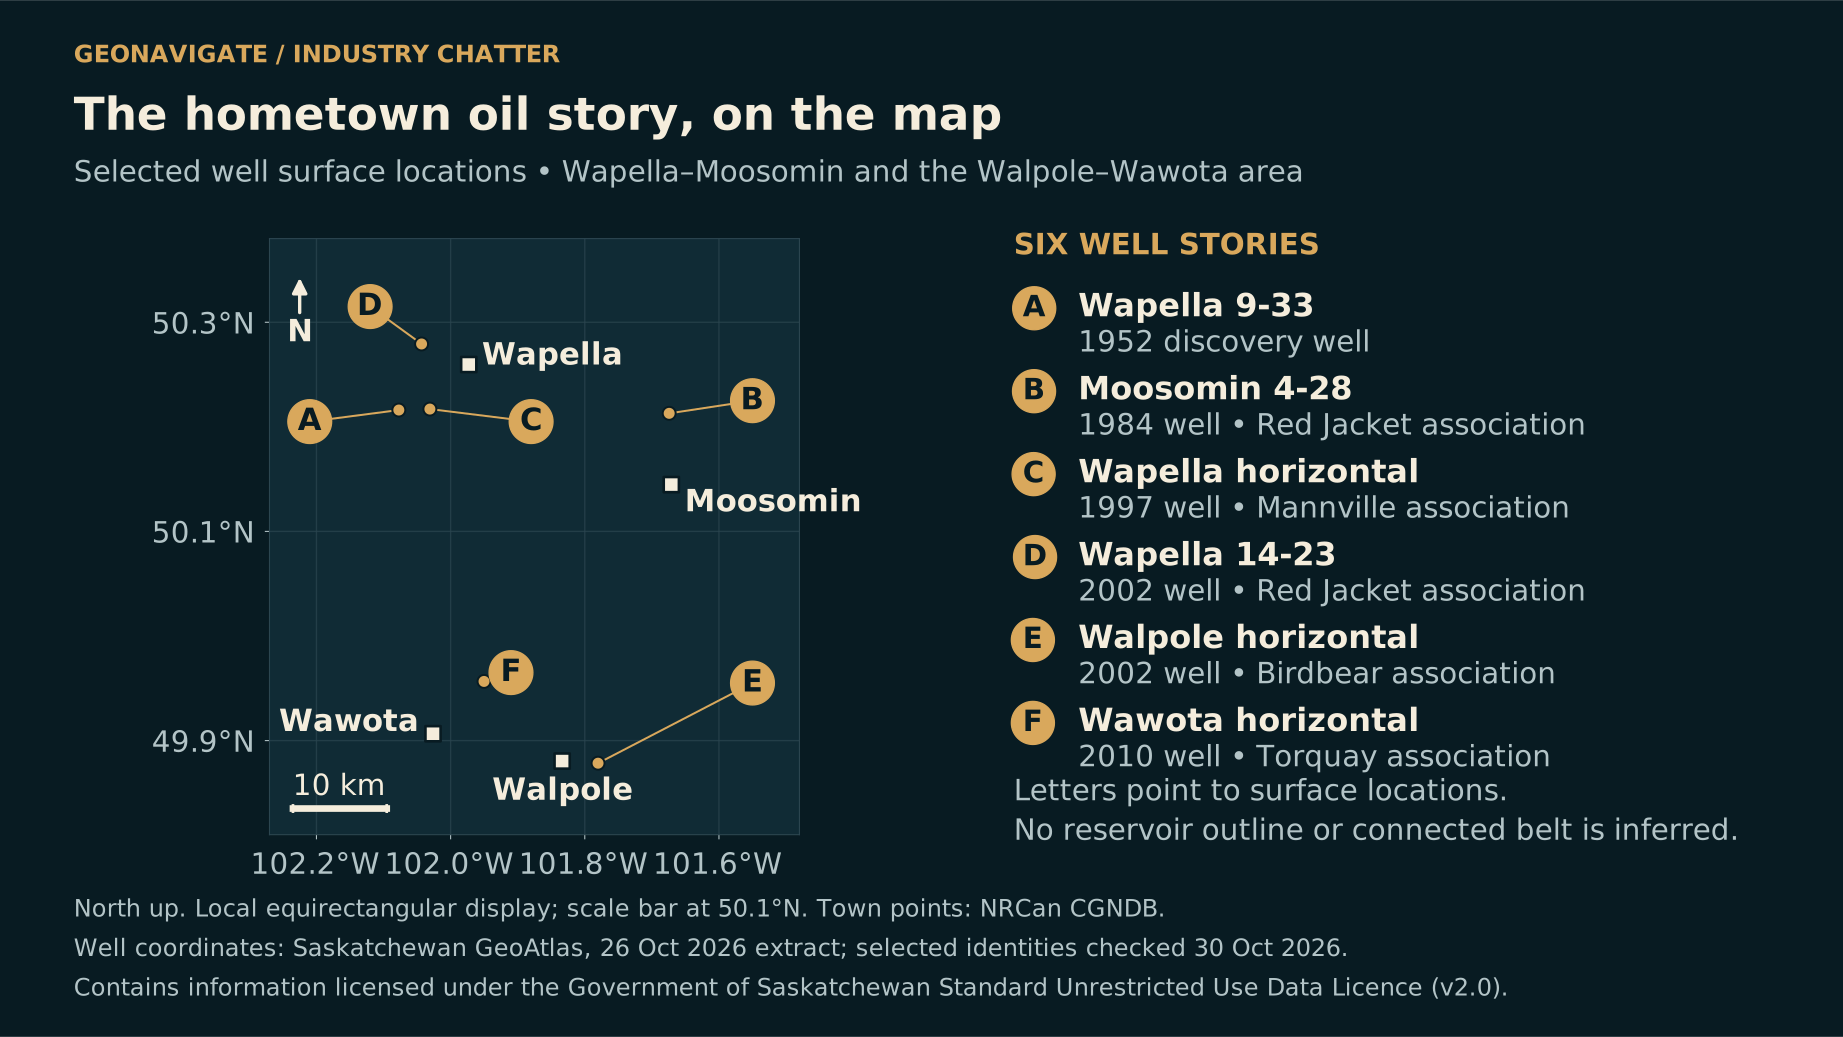
North-up map showing Wapella, Moosomin, Wawota and Walpole with selected well-surface locations and a 10-kilometre scale bar.
Original diagramSelected well-surface locations and representative town points. Lines do not connect the wells into a reservoir, and horizontal bottomholes or trajectories are not shown. The research selection is not an official field boundary.Original explanatory graphic by GeoNavigate; historical, geological and data sources credited separately. Contains information licensed under the Government of Saskatchewan Standard Unrestricted Use Data Licence (Version 2.0). · Original GeoNavigate explanatory artwork. · Image record ↗

A familiar stretch of prairie can conceal several completely different oilfields, one above another.

Around Wapella and Moosomin, the road, the farms and the towns are easy to recognize. Underground, the picture changes. Sandstone can become mudstone. A promising bed can thin away, be cemented shut, or disappear beneath an ancient erosion surface. Two nearby wells can encounter very different reservoirs.

For GeoNavigate's Jory Young, this is home country. That makes the questions personal as well as geological. Who drilled the early producing wells? What did they actually recover? And could modern horizontal drilling open up another chapter?

The answer begins with a surprise. Horizontal wells have already been drilled around Wapella, and oil-producing horizontals are documented in nearby, distinct formations. The useful question is where a lateral would contact connected, oil-bearing rock.

This is GeoNavigate Industry Chatter. We will follow the commercial discoveries of nineteen fifty-two, read the evidence preserved in rock core, compare dated production records, and explore the separate opportunities around Walpole and Wawota. The story starts with two wells, two reservoirs, and a distinction between a promising test and oil actually produced.

Chapter sources1256

CHAPTER 02

The first commercial discovery sequence
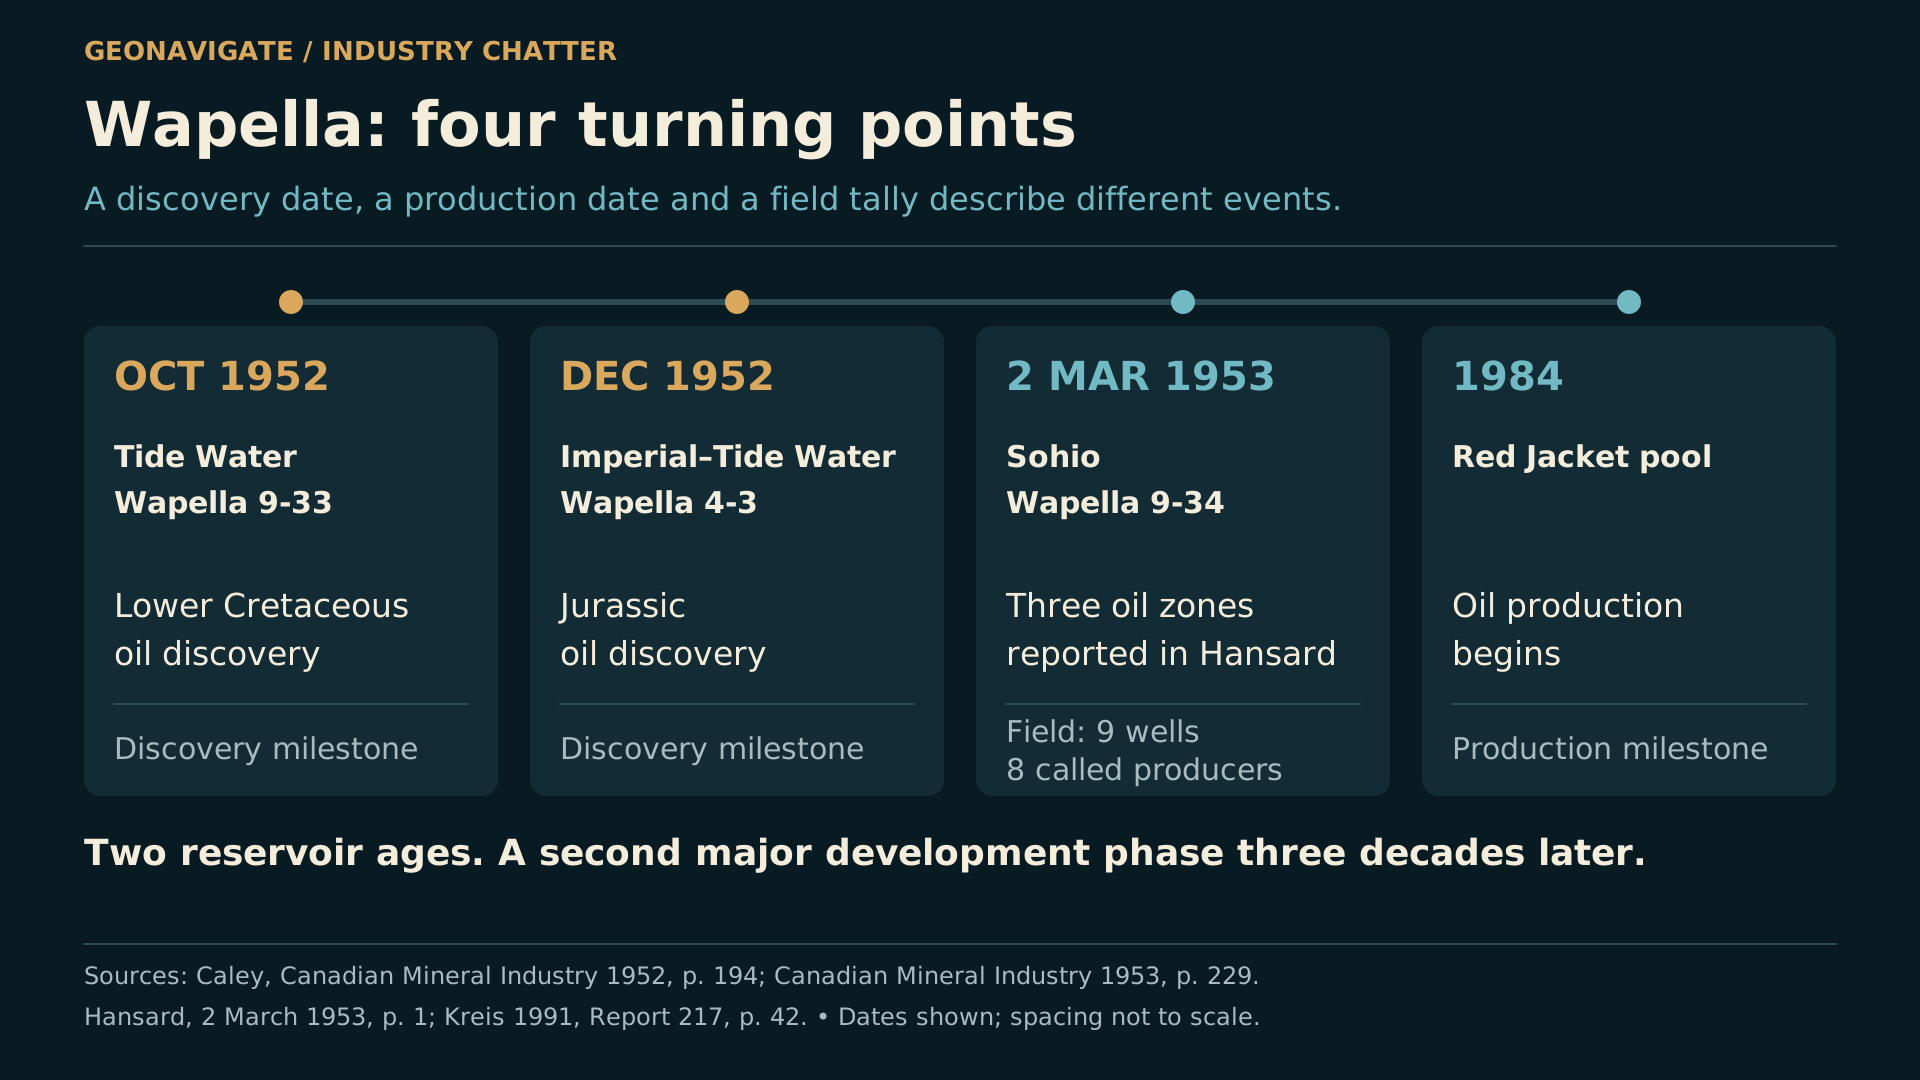
Timeline separating the October 1952 Cretaceous discovery, December 1952 Jurassic discovery and March 1953 legislative announcement.
Original diagramThe two 1952 commercial discoveries opened different reservoirs. Discovery, spud, drilling-finish and on-production dates are separate milestones. Later registry names do not establish the original drilling company.Original explanatory graphic by GeoNavigate; historical, geological and data sources credited separately. · Original GeoNavigate explanatory artwork. · Image record ↗

In October nineteen fifty-two, Tide Water Associated Oil Company's Wapella nine thirty-three discovered oil in Lower Cretaceous sandstone.

The contemporary federal account placed the productive sand at about twenty-two hundred feet, roughly six hundred and seventy metres. It described around twenty feet of productive interval and a test indicating an initial capacity of about one hundred barrels a day.

Those words matter. Initial capacity was a test result. It was not a promise that the well would deliver that rate every day for the rest of its life.

The modern registry provides another part of the chronology. The record now named CPEC Wapella nine thirty-three, licence fifty-two J zero zero one, has an October fourth spud date, an October twenty-first drilling finish, and an October thirtieth on-production date.

Today's name on an old well is not necessarily the company that drilled it. Here, the contemporary report identifies Tide Water. Matching the land description and well identifiers lets us connect the old account to the later record.

This is a documented commercial discovery sequence. It does not establish that nobody had drilled an exploratory hole anywhere in the wider district before it.

Chapter sources125

CHAPTER 03

Another well, an older reservoir
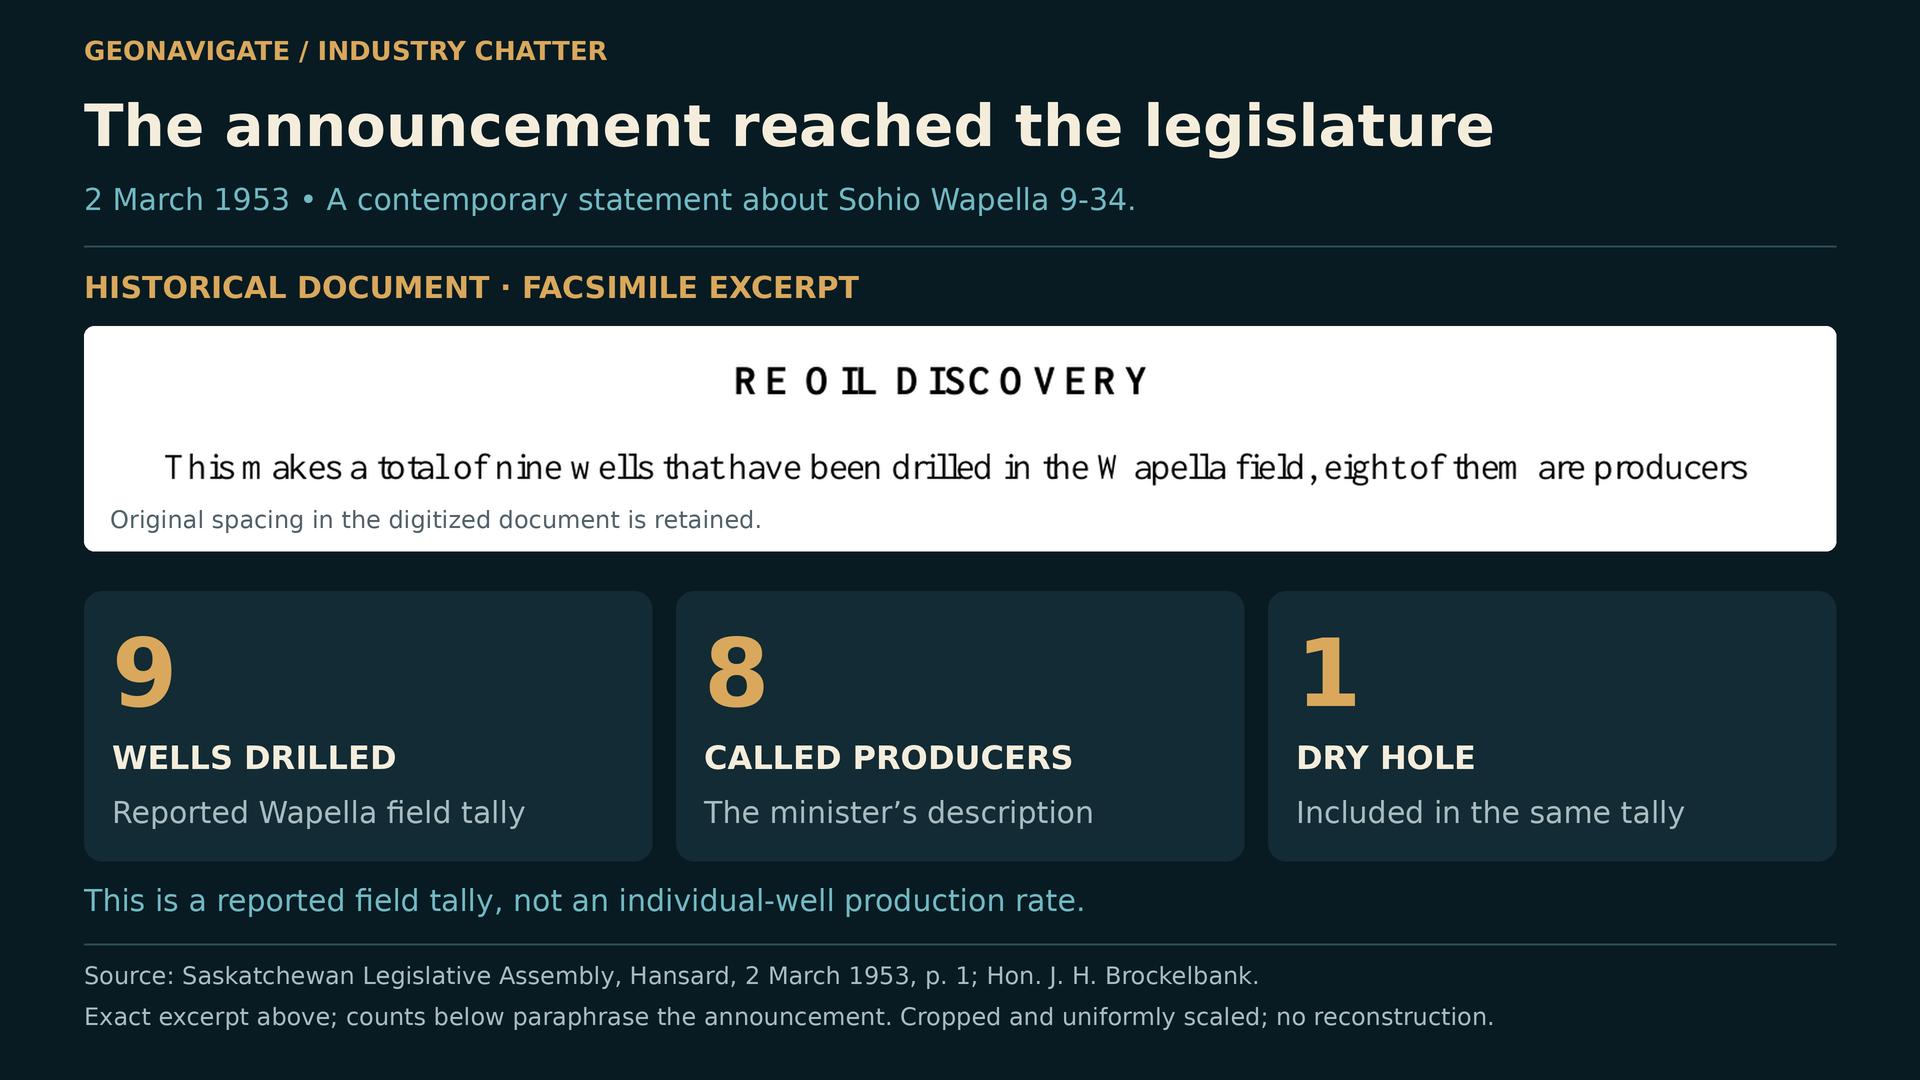
Source excerpt from Saskatchewan Hansard of 2 March 1953, accompanied by an attributed summary of the nine-well field tally.
Episode visualAn actual short excerpt from the digitized Hansard announcement by Hon. J. H. Brockelbank, 2 March 1953, p. 1. The historical tally of nine drilled wells, eight considered producers and one dry hole is a contemporary classification, not a lifetime success ratio.Saskatchewan Legislative Assembly; explanatory presentation by GeoNavigate. · Image record ↗

Another discovery changed the geological story.

Imperial and Tide Water's Wapella four three found oil in Jurassic rock, older than the Cretaceous sand in the first discovery. The nineteen fifty-two federal report described a seven-foot productive interval at about twenty-three hundred and fifty feet, with an initial potential of roughly seventy-five barrels a day.

The following year's mineral-industry summary dated that Jurassic discovery to December nineteen fifty-two. Discovery and regular production are different milestones; they need not share a date.

By March second, nineteen fifty-three, Wapella had reached the floor of the Saskatchewan legislature. Minister J. H. Brockelbank reported another strike, Sohio Wapella nine thirty-four, southwest of town. He described favourable drillstem-test recoveries from Wapella sand and two Jurassic intervals.

His field tally was nine wells drilled, eight considered producers and one dry hole.

That was an encouraging early report. It also reveals the central character of the district: several opportunities at different levels. A map with one circle labelled Wapella can hide that vertical complexity. Even in the first few months, the story was already about more than one sand.

Chapter sources123

CHAPTER 04

What the field actually produced
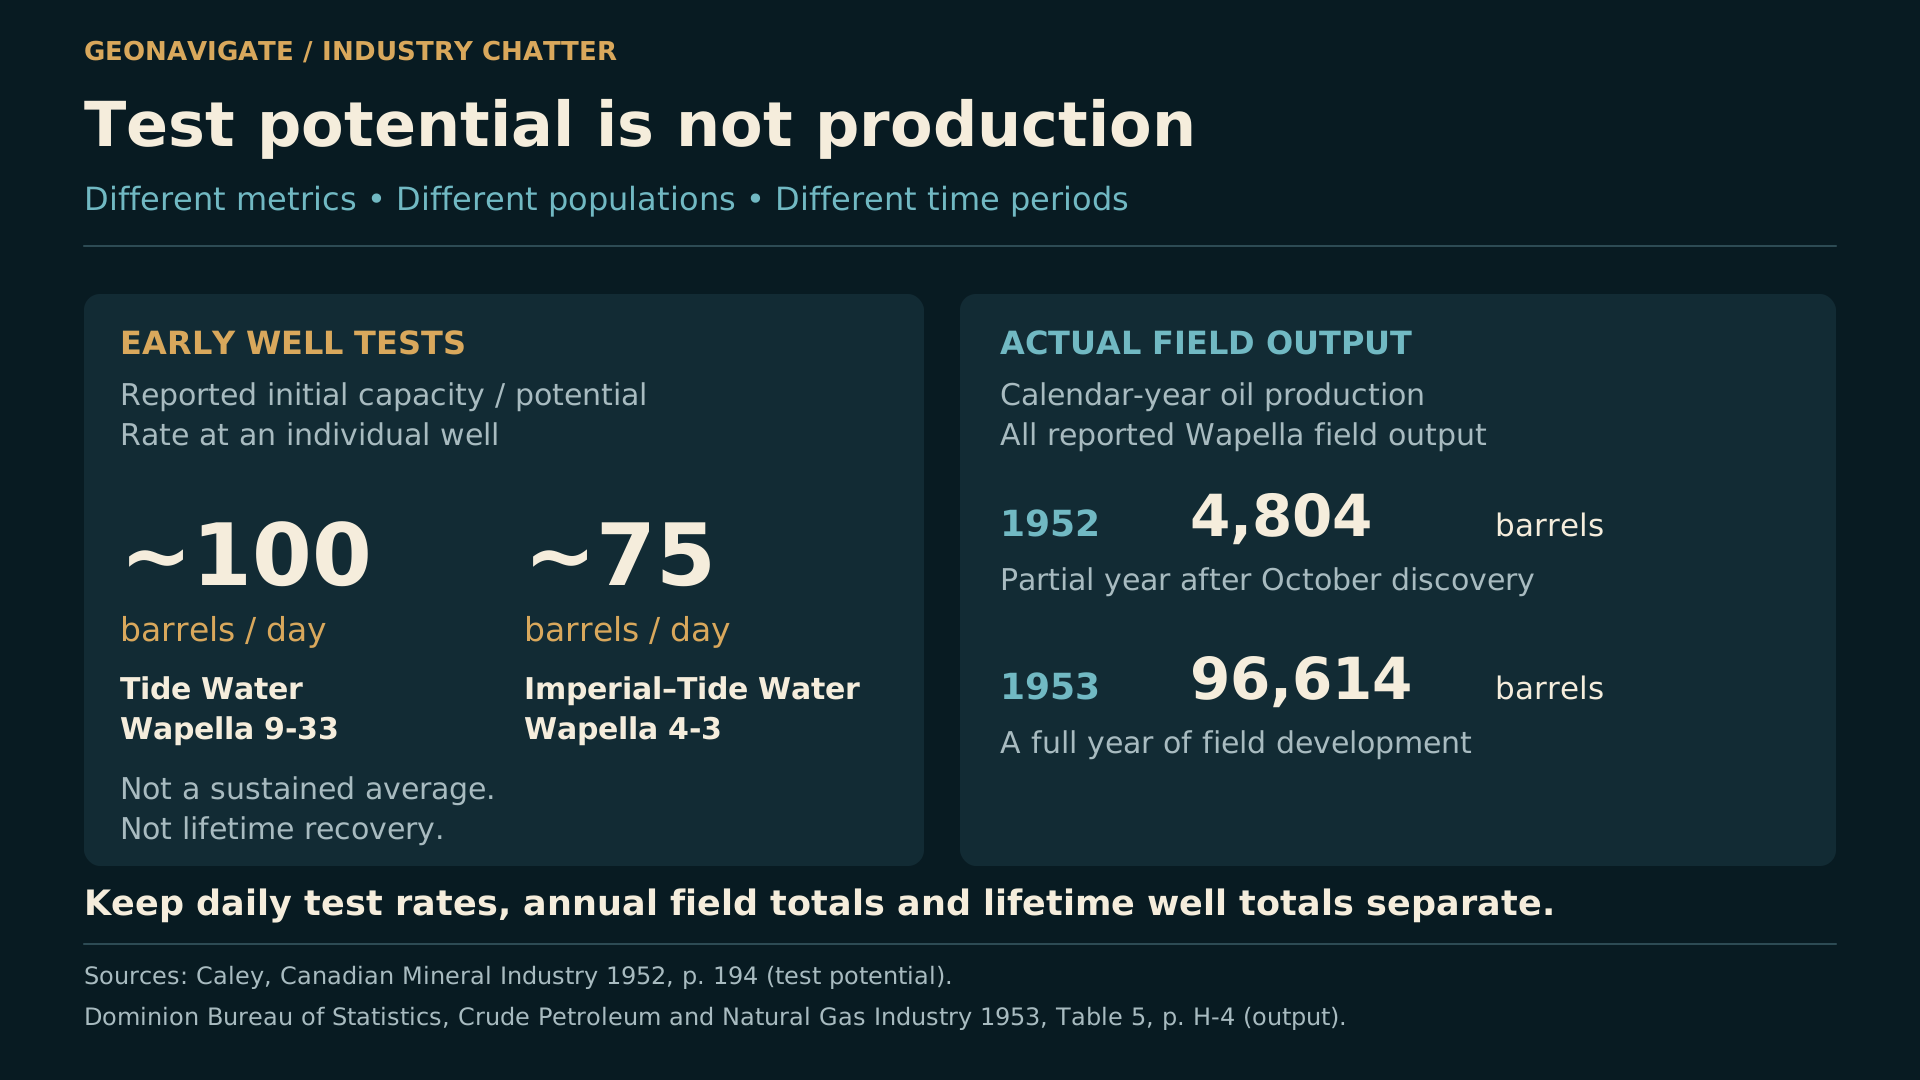
Separate panels distinguish approximately 100 and 75 barrels per day initial test potential from field totals of 4,804 barrels in 1952 and 96,614 in 1953.
Original diagramInitial test capacity and annual field output have different units and scopes. The 1952 field total covers a partial production year. The annual change is not a like-for-like performance increase for the discovery well.Original explanatory graphic by GeoNavigate; historical, geological and data sources credited separately. · Original GeoNavigate explanatory artwork. · Image record ↗

What happened after those promising tests?

The Dominion Bureau of Statistics reported Wapella field output of four thousand eight hundred and four barrels in nineteen fifty-two, and ninety-six thousand six hundred and fourteen barrels in nineteen fifty-three.

These are annual field totals. The first covers only part of a production year after the autumn discovery. The increase reflects more time on stream and development of the field; it cannot be used as a simple improvement ratio for the discovery well.

The older records also connect to a remarkably long operating story. The registry entry for Wapella four three dates back to nineteen fifty-two. Its associated completion reported nineteen point one cubic metres of oil in September twenty twenty-six, alongside eleven hundred and twenty-six point four cubic metres of water.

That does not establish uninterrupted production from the original Jurassic interval. The current completion is associated with Wapella Sand, and a well's completion history can change.

It does show why the records deserve close reading. Spud date, discovery date, current producing formation, monthly output and cumulative recovery each answer a different question.

Chapter sources456

CHAPTER 05

Two ages of sandstone

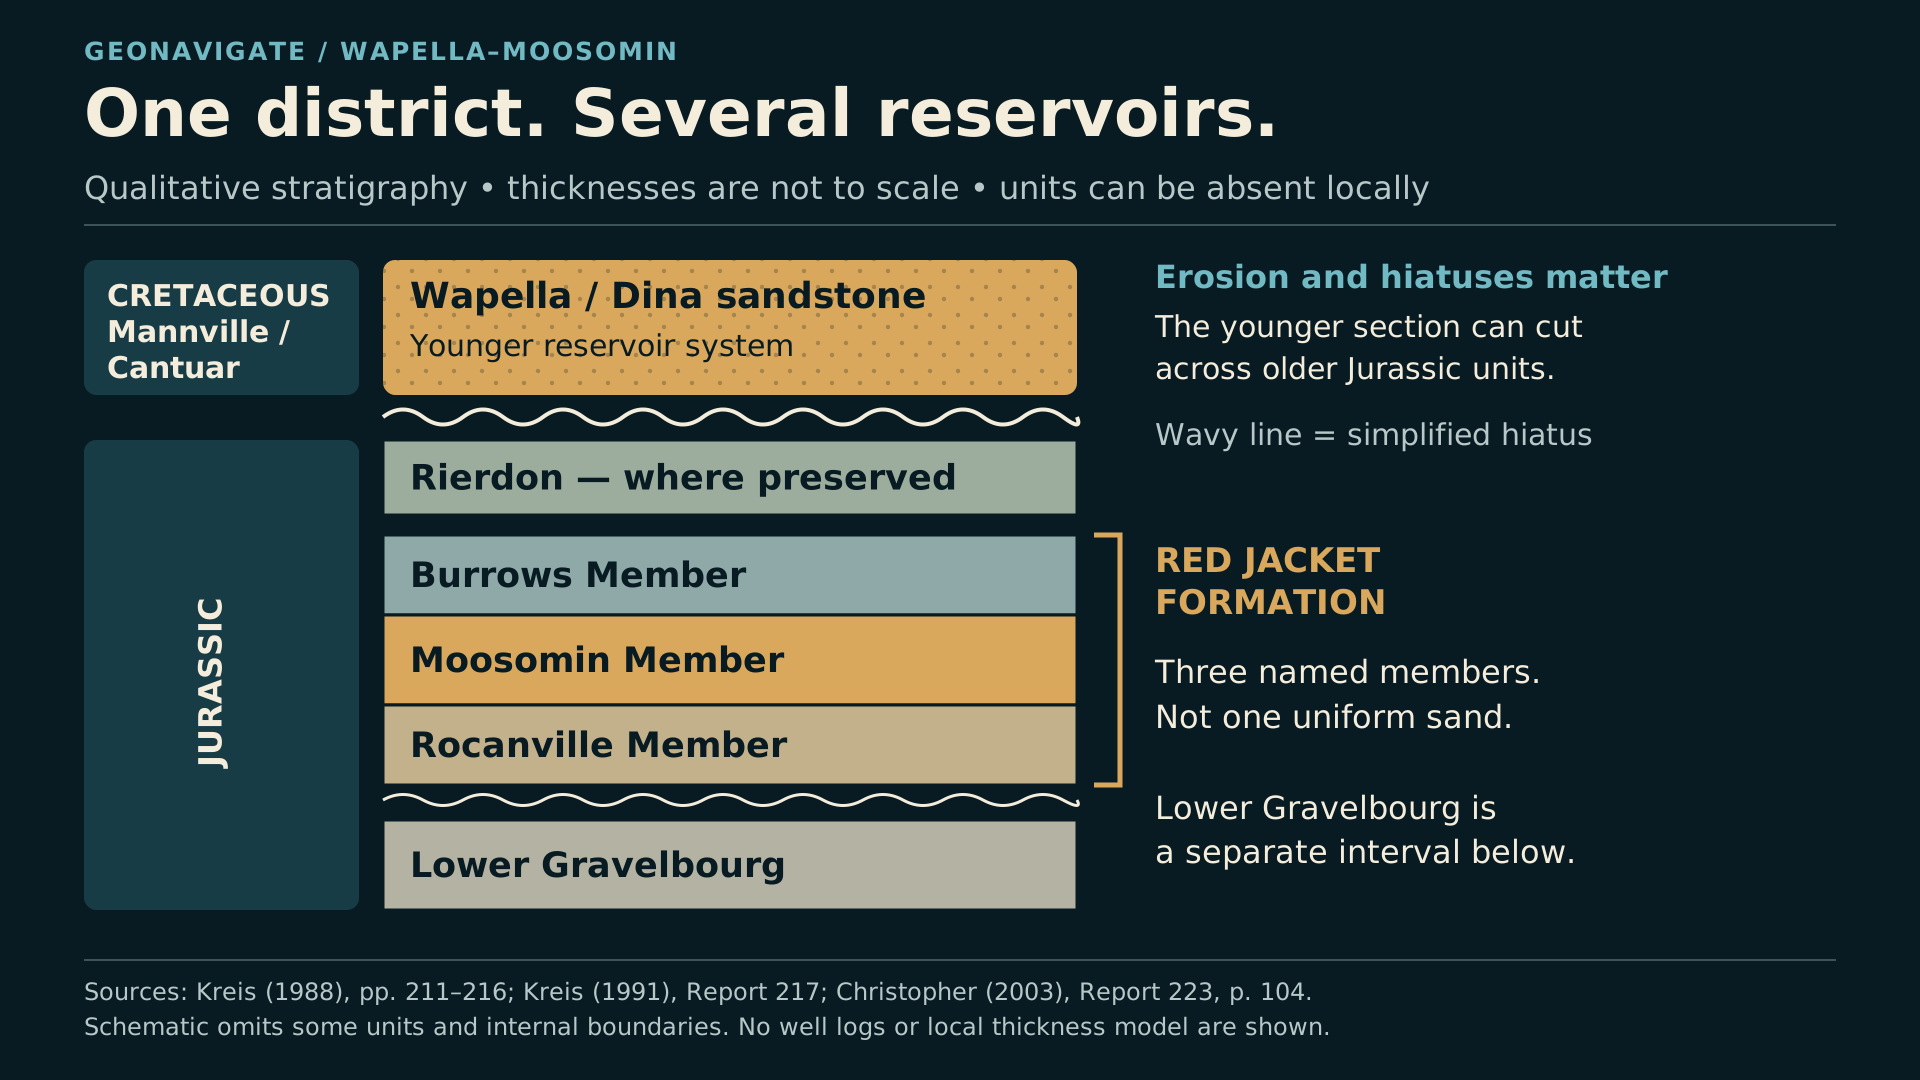
Qualitative stratigraphy separates younger Mannville/Dina sandstone from the Jurassic Red Jacket members and underlying lower Gravelbourg.
Original diagramOne district contains several stratigraphic targets. The Red Jacket’s Rocanville, Moosomin and Burrows members are distinct from the younger Wapella/Mannville reservoir and lower Gravelbourg below. Thicknesses are not to scale; some units and internal boundaries are omitted or locally absent.Original explanatory graphic by GeoNavigate; historical, geological and data sources credited separately. · Original GeoNavigate explanatory artwork. · Image record ↗
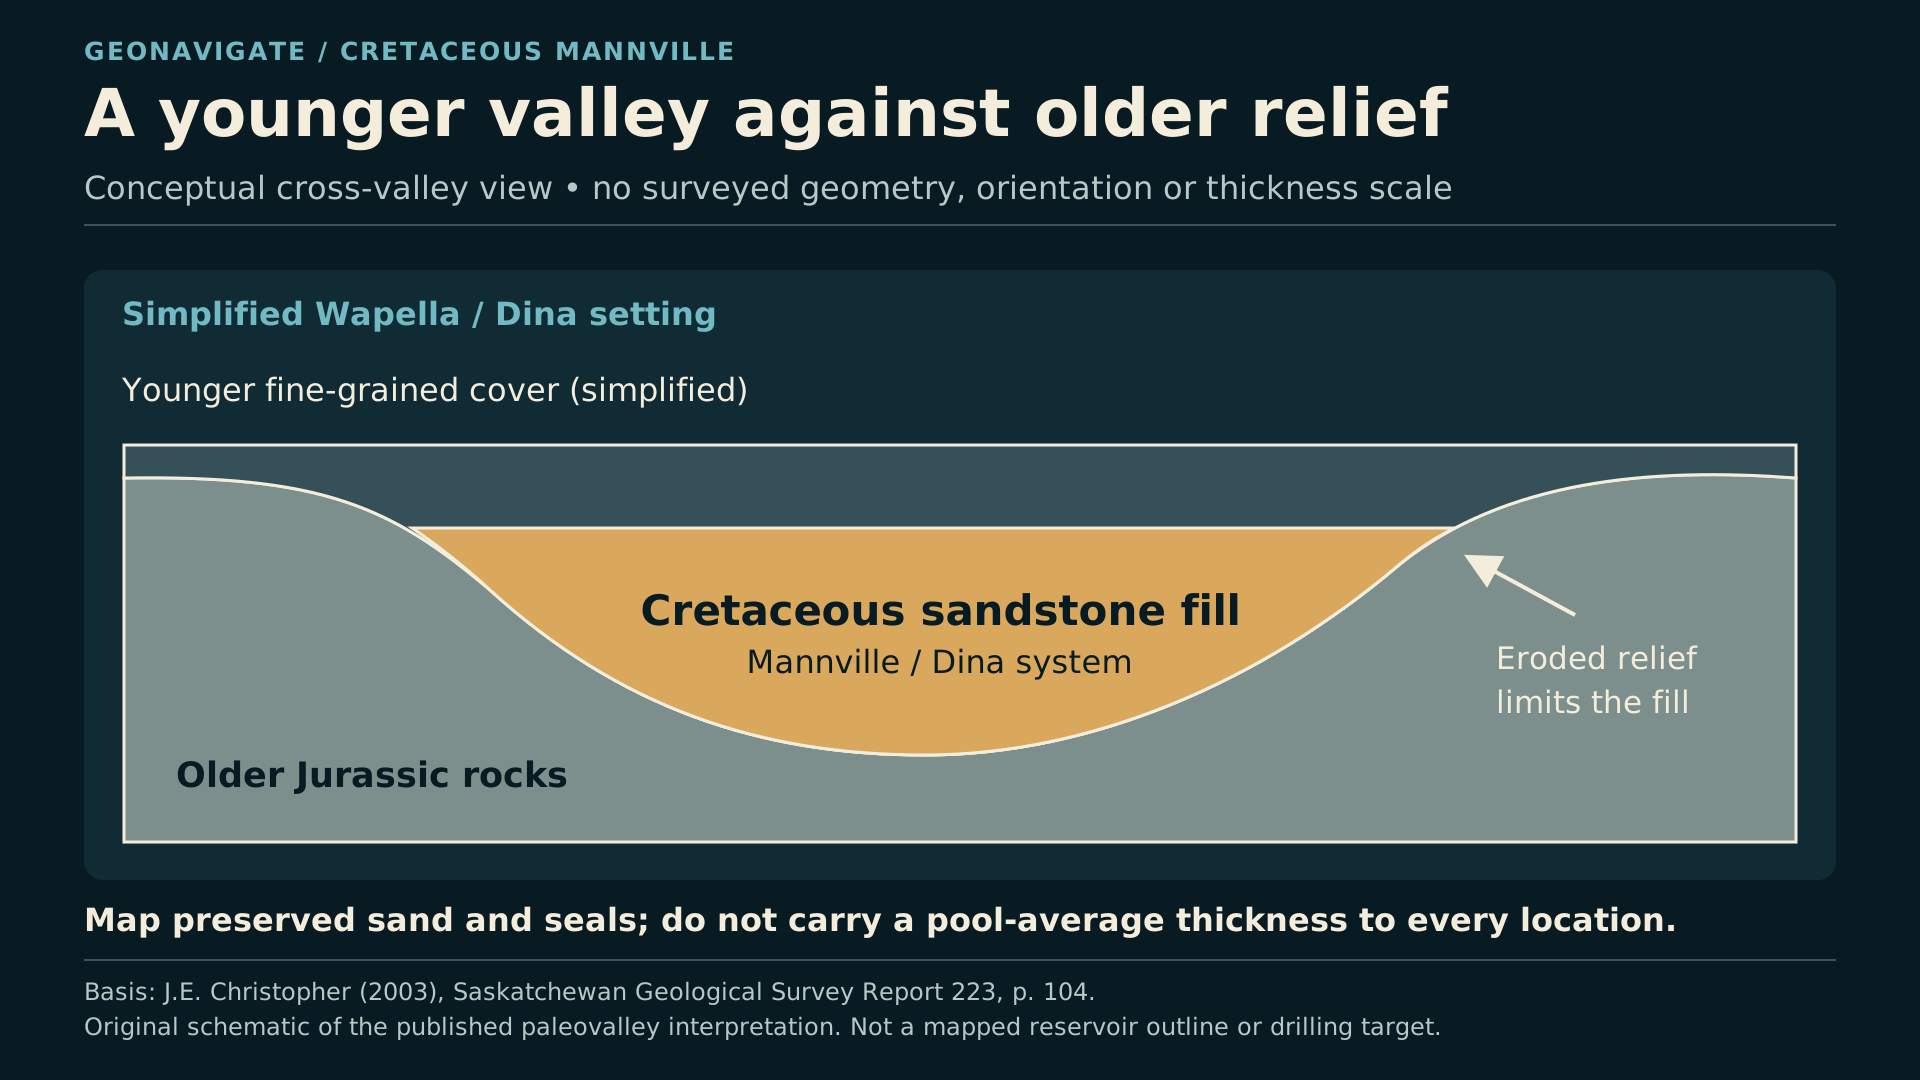
Conceptual cross-valley sketch shows younger Mannville/Dina sand filling relief cut against older Jurassic rocks.
Original diagramOriginal explanation of the Wapella Mannville paleovalley concept described by Christopher (2003), p. 104. The geometry is synthetic: it is not a measured local cross-section, orientation, net-pay model or map of connected oil.Original explanatory graphic by GeoNavigate; historical, geological and data sources credited separately. · Original GeoNavigate explanatory artwork. · Image record ↗

To understand these wells, separate the main sandstone systems.

The younger Wapella reservoir belongs to the Cretaceous Mannville succession. Christopher's geological synthesis describes it as a Dina sandstone reservoir in a tributary of an ancient valley system, against older Jurassic relief.

That synthesis lists historical average net pay of five point eight six metres and average porosity of twenty-seven point nine percent. These are report-era pool figures, not thickness or porosity to assign to every new location.

Below, the Jurassic Red Jacket Formation has its own architecture. Its named members are Rocanville, Moosomin and Burrows. The lower Gravelbourg is a separate underlying interval.

An old record labelled Jurassic, a current completion labelled Red Jacket, and a Wapella Sand producer should not be blended into one target.

The distinction becomes practical when planning a horizontal well. A lateral designed for one sandstone cannot be assumed to work in another simply because both lie under the same farming district.

Think of the subsurface as several different landscapes stacked through geological time. Each has its own erosion, sediment distribution, rock quality and trapping conditions. We have to reconstruct them separately.

Chapter sources78

CHAPTER 06

Read the core: currents and quiet water
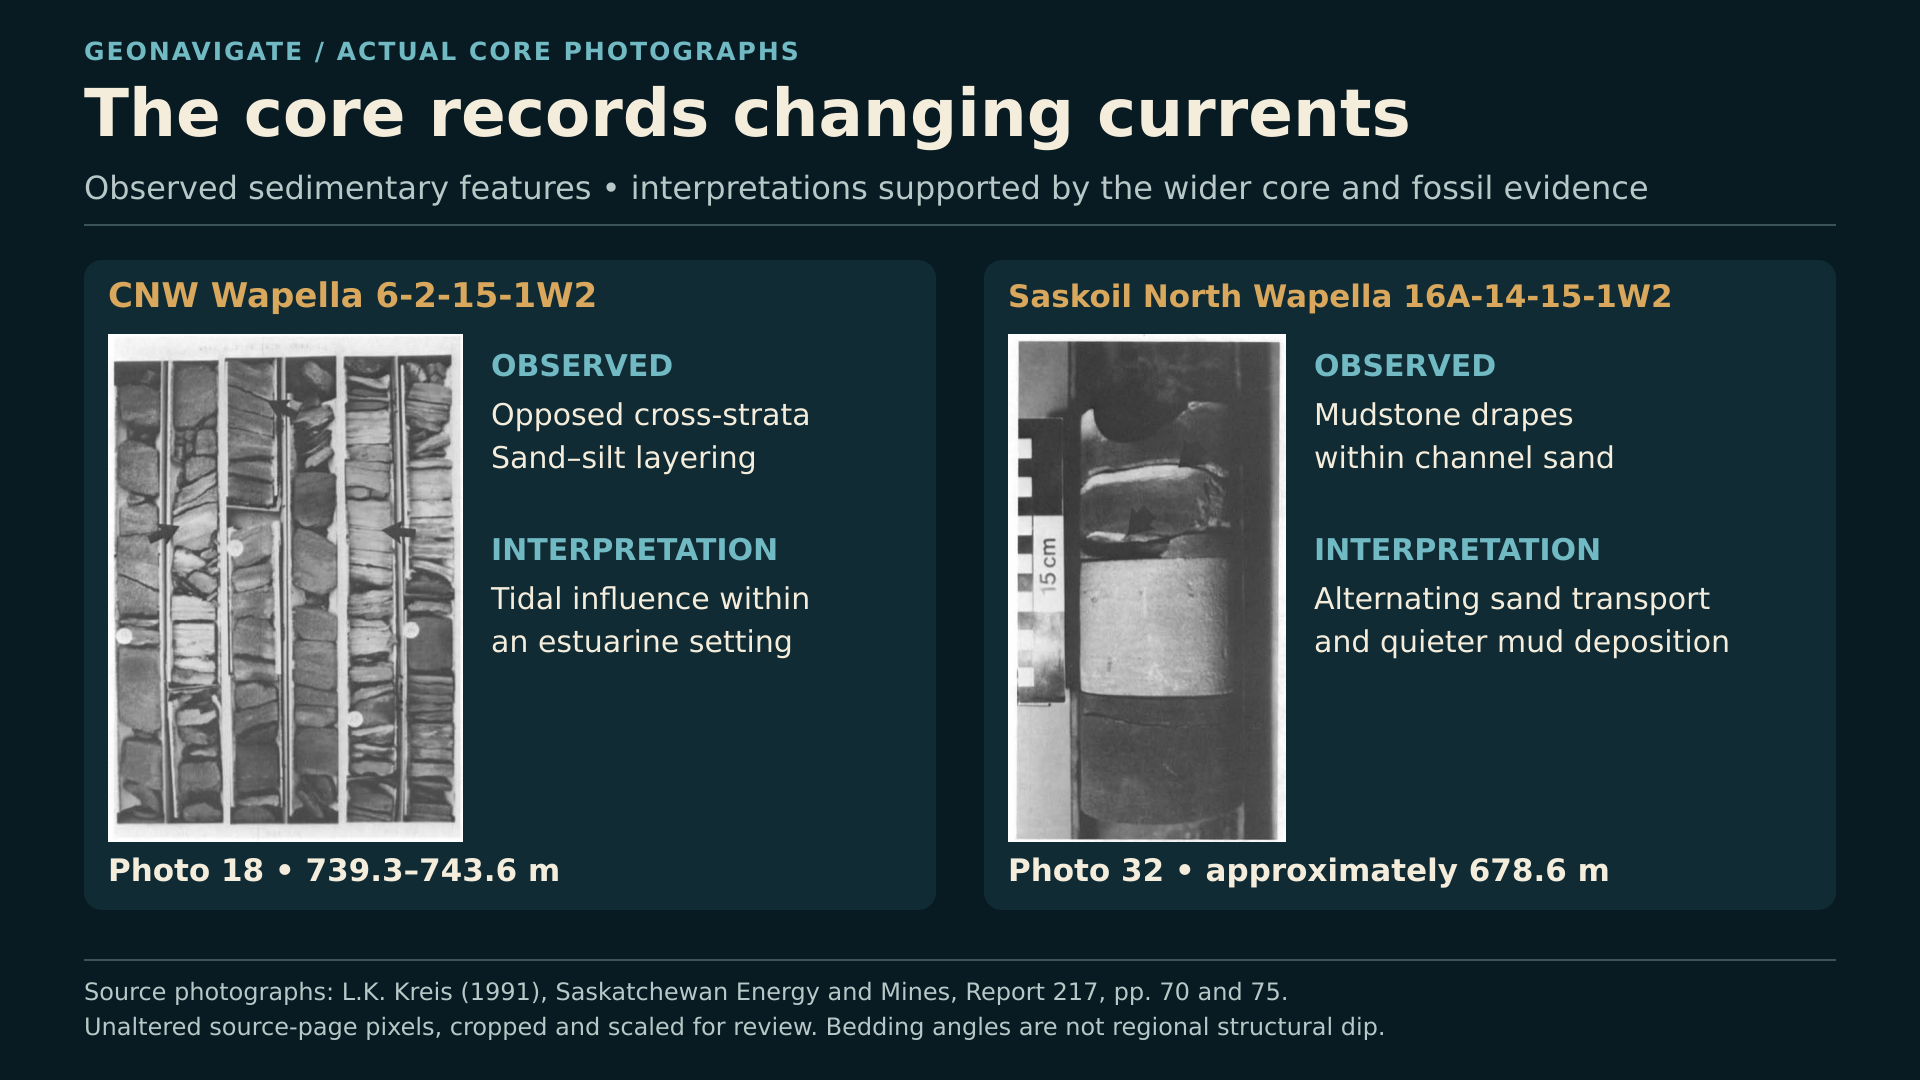
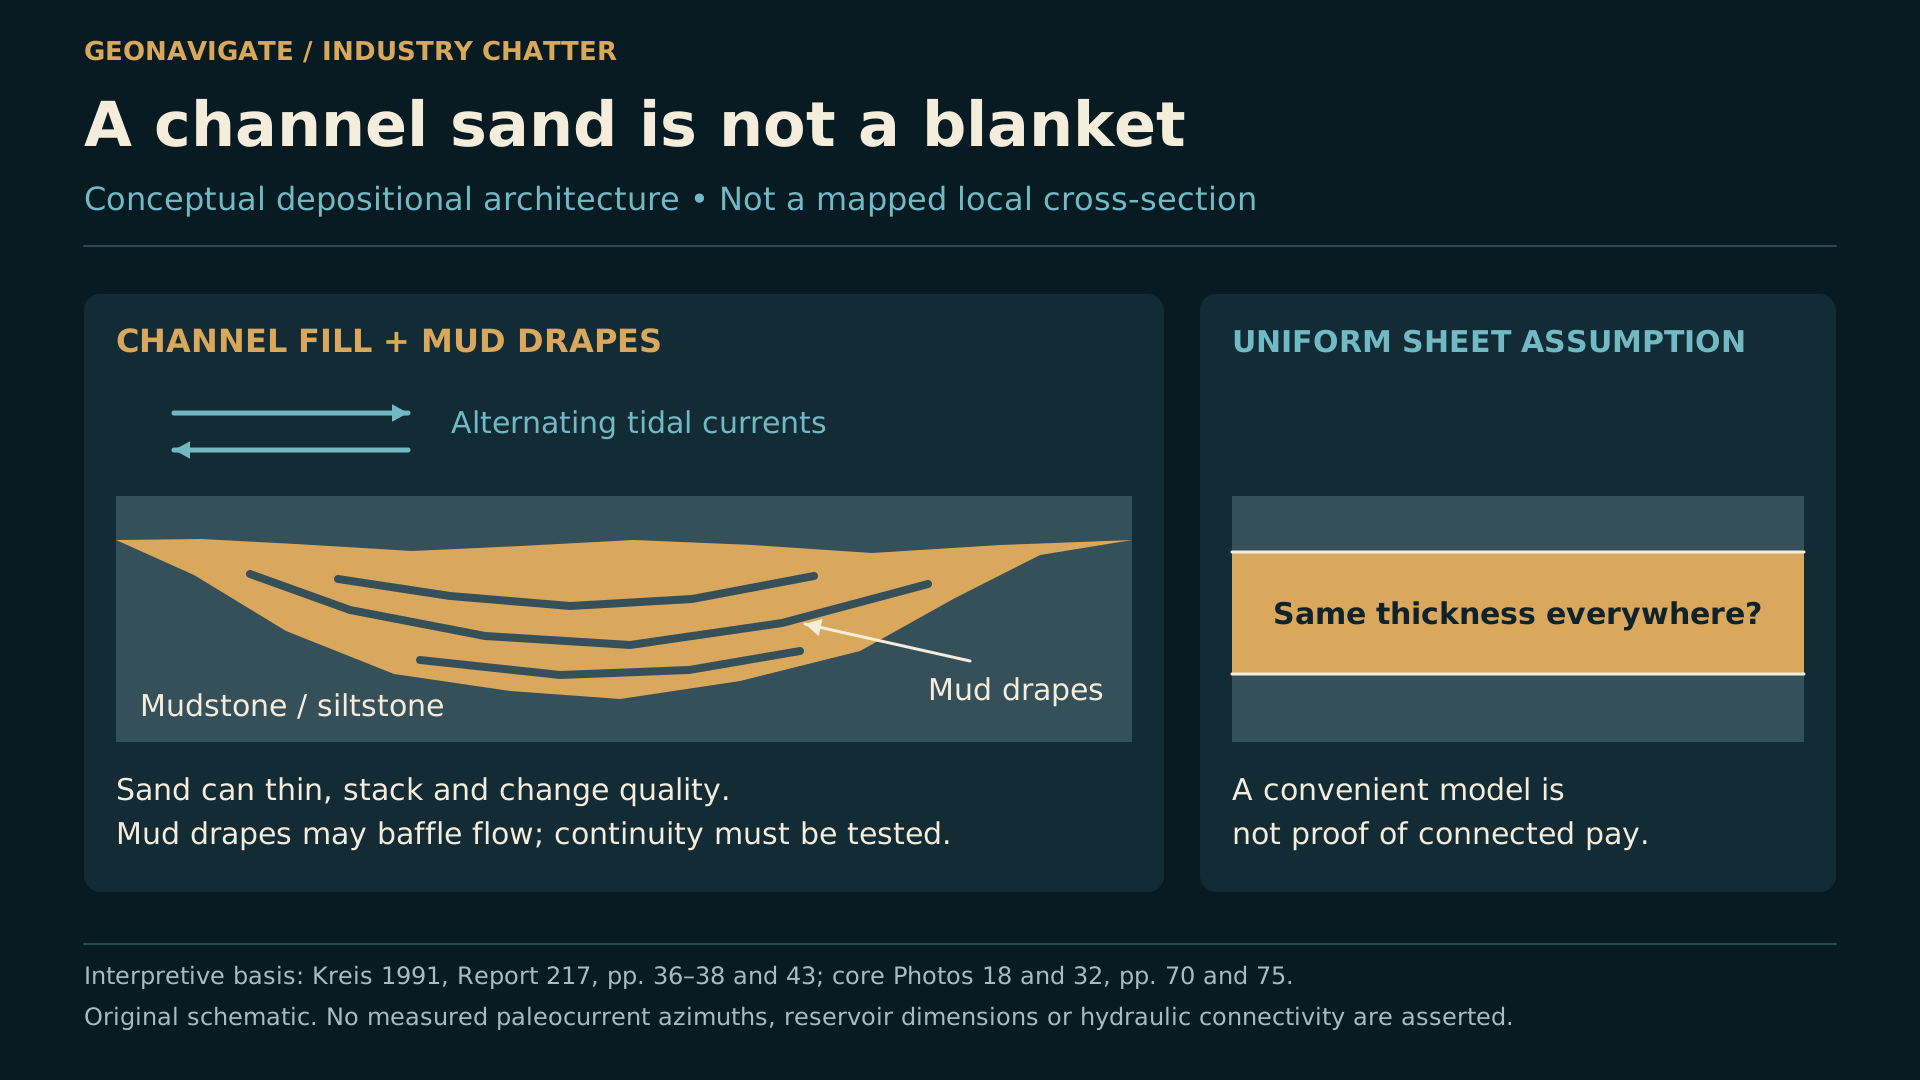
Published Wapella core photographs show opposed cross-stratification and thin mud drapes in sandstone.
Source imageActual source core photographs from L. K. Kreis (1991), Report 217, published pp. 70 and 75. They illustrate structures used with other evidence in estuarine/tidal interpretations. These are source images, not AI reconstructions; patchy sand alone is not proof of turbidites.L. K. Kreis / Saskatchewan Energy and Mines; explanatory presentation by GeoNavigate. · Image record ↗
Conceptual tidal-channel sketch distinguishes moving sand during stronger currents from mud settling in quieter water.
Original diagramOriginal explanatory diagram of tidal sand movement and mud deposition. It is a process illustration informed by the published core study, not a surveyed reconstruction of an individual ancient channel.Original explanatory graphic by GeoNavigate; historical, geological and data sources credited separately. · Original GeoNavigate explanatory artwork. · Image record ↗

The actual core photographs make that reconstruction tangible.

In a Wapella well at six two, township fifteen, range one west of the Second Meridian, the published core interval from roughly seven hundred and thirty-nine to seven hundred and forty-four metres contains opposed cross-stratification. Sand was deposited under changing current directions.

At North Wapella, a photograph from approximately six hundred and seventy-nine metres shows thin mud drapes within channel sandstone. Between stronger flows that moved sand, quieter conditions allowed mud to settle.

The broader study interprets parts of the Moosomin Member as estuarine, lagoonal, and tidal-flat or channel deposits. That interpretation comes from several kinds of evidence together, including sedimentary structures and fossils.

Patchy sandstone by itself does not prove a turbidite origin. Density-flow deposits are a hypothesis to test with their own diagnostic evidence; the published local model is predominantly estuarine and tidal.

For drilling, the important observation is the heterogeneity. Clean sand can be interrupted by mud, silt and cement. The photographed layers are real. The animated depositional sketches in this episode are explanations of the processes, not surveyed reconstructions of an individual ancient channel.

Chapter sources9

CHAPTER 07

Why a formation can be present without useful pay
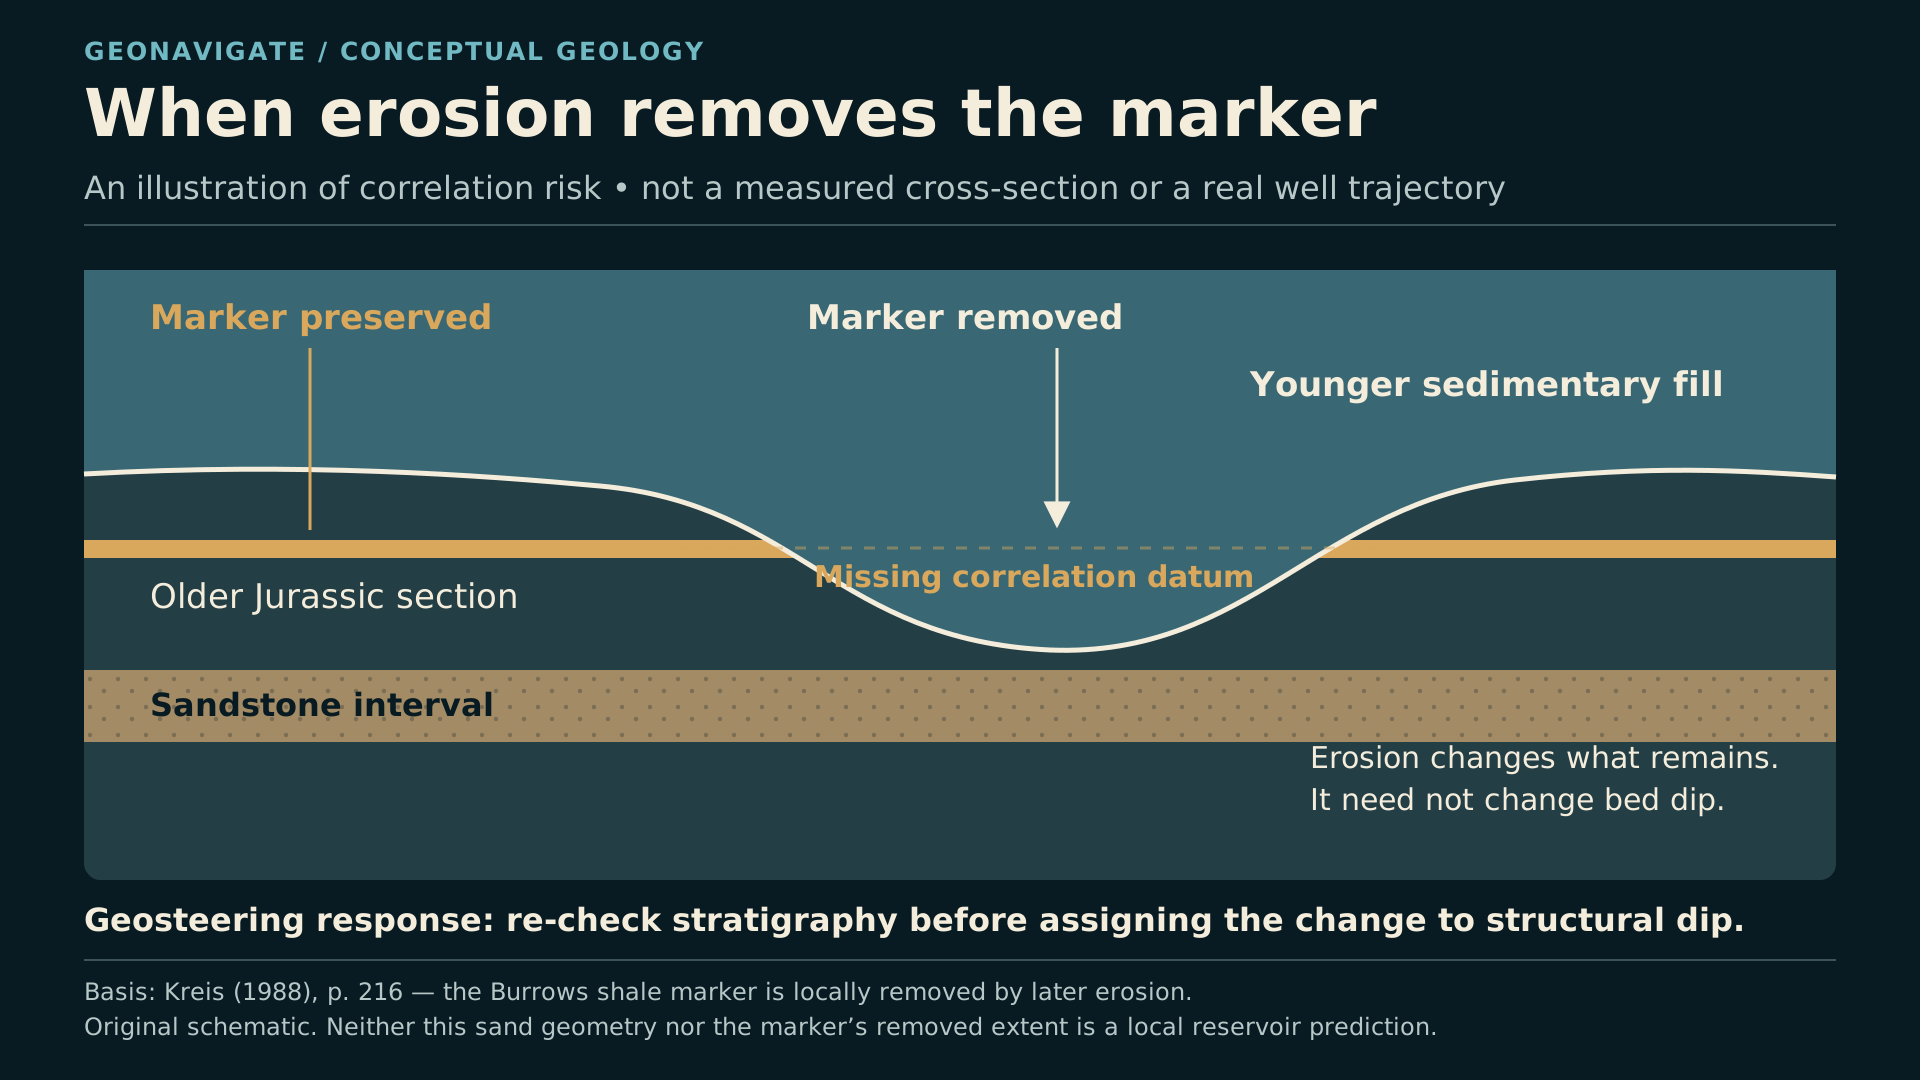
Conceptual comparison shows a shale marker preserved in one section and removed by erosion in another.
Original diagramThe Burrows marker can be useful where preserved and absent where eroded. The schematic explains a correlation problem; it does not locate a mapped local erosion edge, fault, fluid contact or proposed well path.Original explanatory graphic by GeoNavigate; historical, geological and data sources credited separately. · Original GeoNavigate explanatory artwork. · Image record ↗
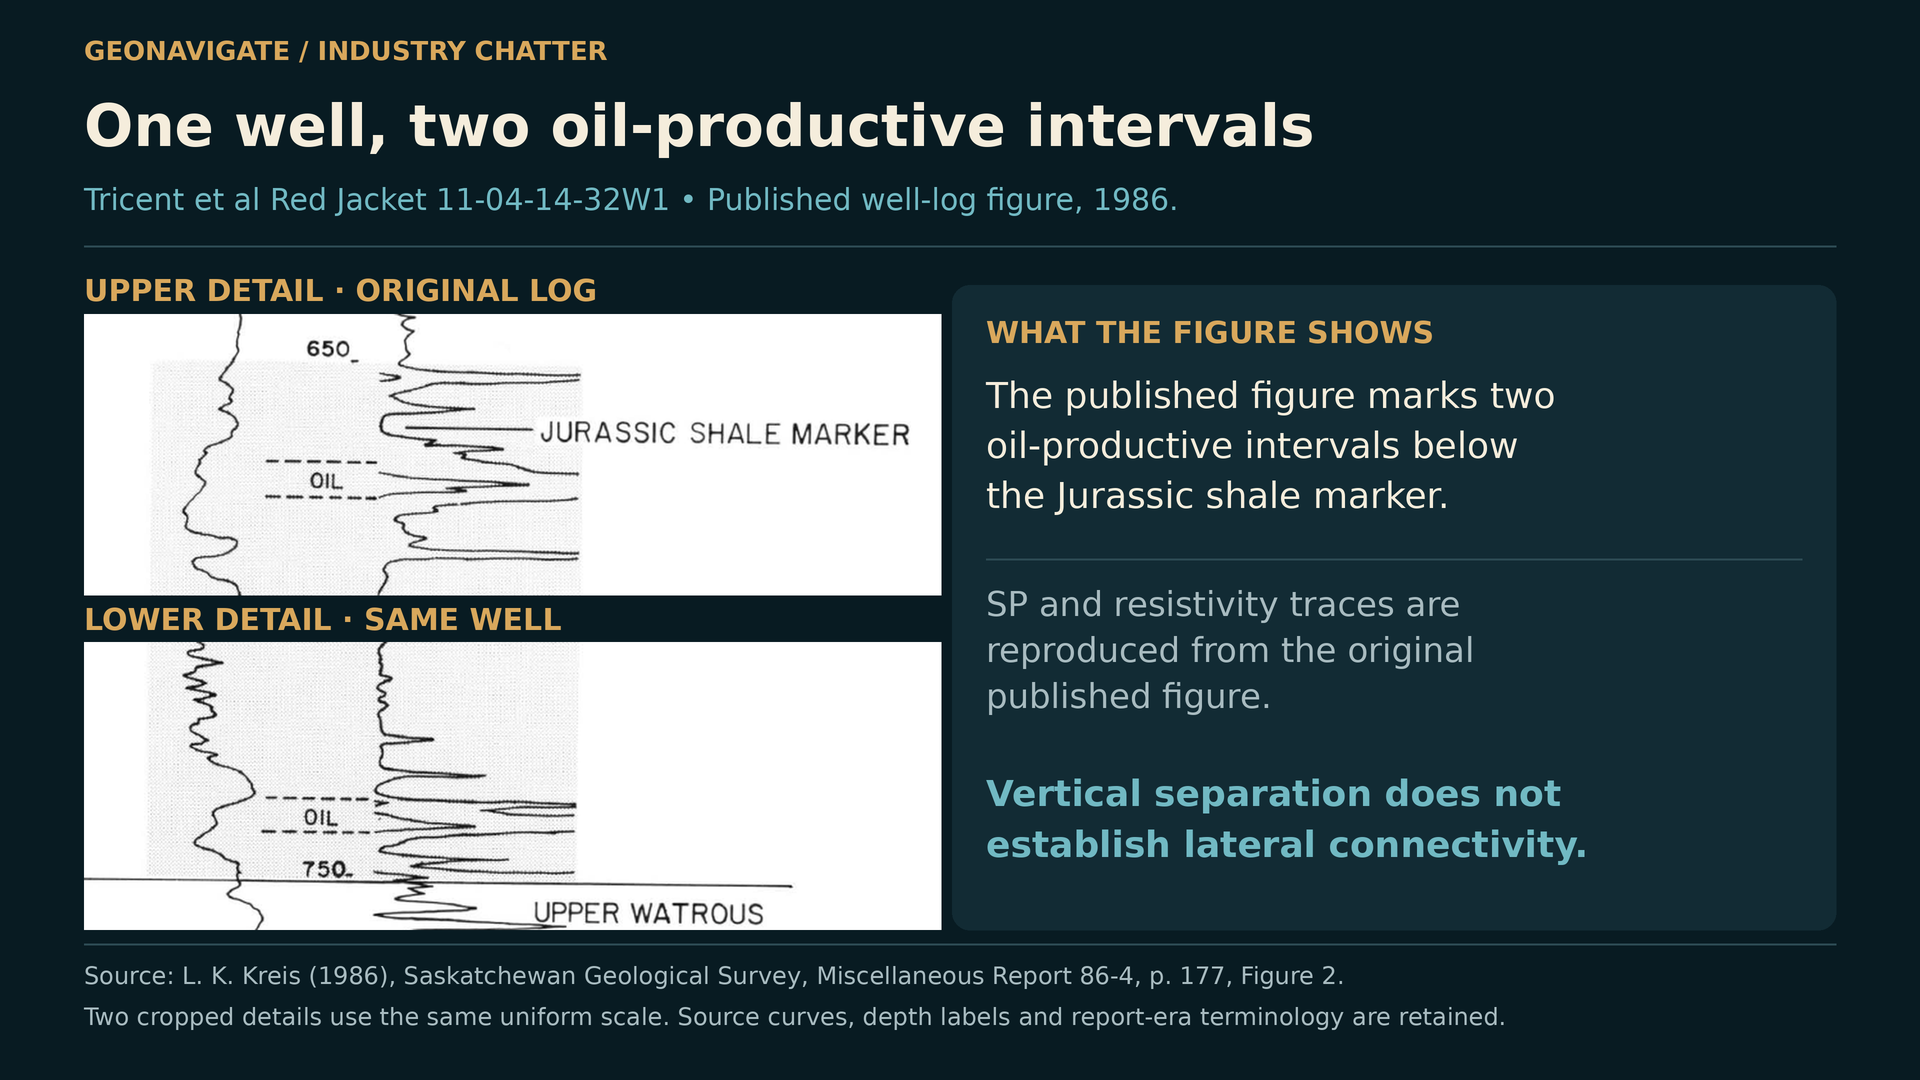
Uniformly enlarged portions of the actual published SP/resistivity log from Tricent et al. Red Jacket 11-4-14-32W1.
Episode visualActual well-log figure from Kreis (1986), Figure 2, p. 177, showing two oil-producing intervals in Tricent et al. Red Jacket 11-4-14-32W1. This is not the Moosomin 4-28 log. The displayed source details preserve the study-era labels and identical scaling.L. K. Kreis / Saskatchewan Geological Survey; explanatory presentation by GeoNavigate. · Image record ↗

A formation name tells us where we are in the stratigraphy. It does not tell us how much oil will flow.

Some sandstone has connected pores. Elsewhere, cement occupies the spaces between grains, or muddy layers restrict movement between beds. A clean-looking gamma-ray response can help identify a sandstone, but it cannot establish movable oil or permeability by itself.

Erosion adds another complication. The published Red Jacket work describes a shale marker in the Burrows Member that is useful where preserved and missing in some places because it was eroded.

A missing marker can tempt an interpreter to force the wrong correlation. The next recognizable sand may belong to another interval, or the expected reservoir may have been partly removed.

This is why a single smooth formation surface is an incomplete picture. Structure describes the position of a horizon. Reservoir architecture describes what remains inside it.

For a horizontal well, both matter. Staying at the predicted depth of a formation is useful only if the rock at that depth remains a suitable reservoir.

Chapter sources710

CHAPTER 08

Moosomin four twenty-eight: an interval is not a whole well

One Moosomin example captures this distinction.

Kreis's nineteen ninety-one report describes a production attempt in the lower Gravelbourg at Tricent and partners' Moosomin four twenty-eight, township fourteen, range thirty-one. That attempt was abandoned because of poor reservoir quality.

It would be misleading to turn that sentence into a story about the entire well failing.

The modern record at that land description, licence eighty-four E zero three eight, is named Renaissance Moosomin four twenty-eight. Its current completion is associated with Red Jacket. In September twenty twenty-six, the matched production record reported sixty-five point four cubic metres of oil and twenty-six hundred and seventy-four point six cubic metres of water.

The public records reviewed here do not provide the complete sequence of every completion change. We can describe the unsuccessful lower Gravelbourg attempt and the later Red Jacket record without inventing that missing sequence.

This is the lesson: a poor interval does not condemn every reservoir in the borehole. Equally, production from one interval does not prove that another interval will work. The geological name attached to the production is essential.

Chapter sources956

CHAPTER 09

Horizontals are already part of Wapella's story
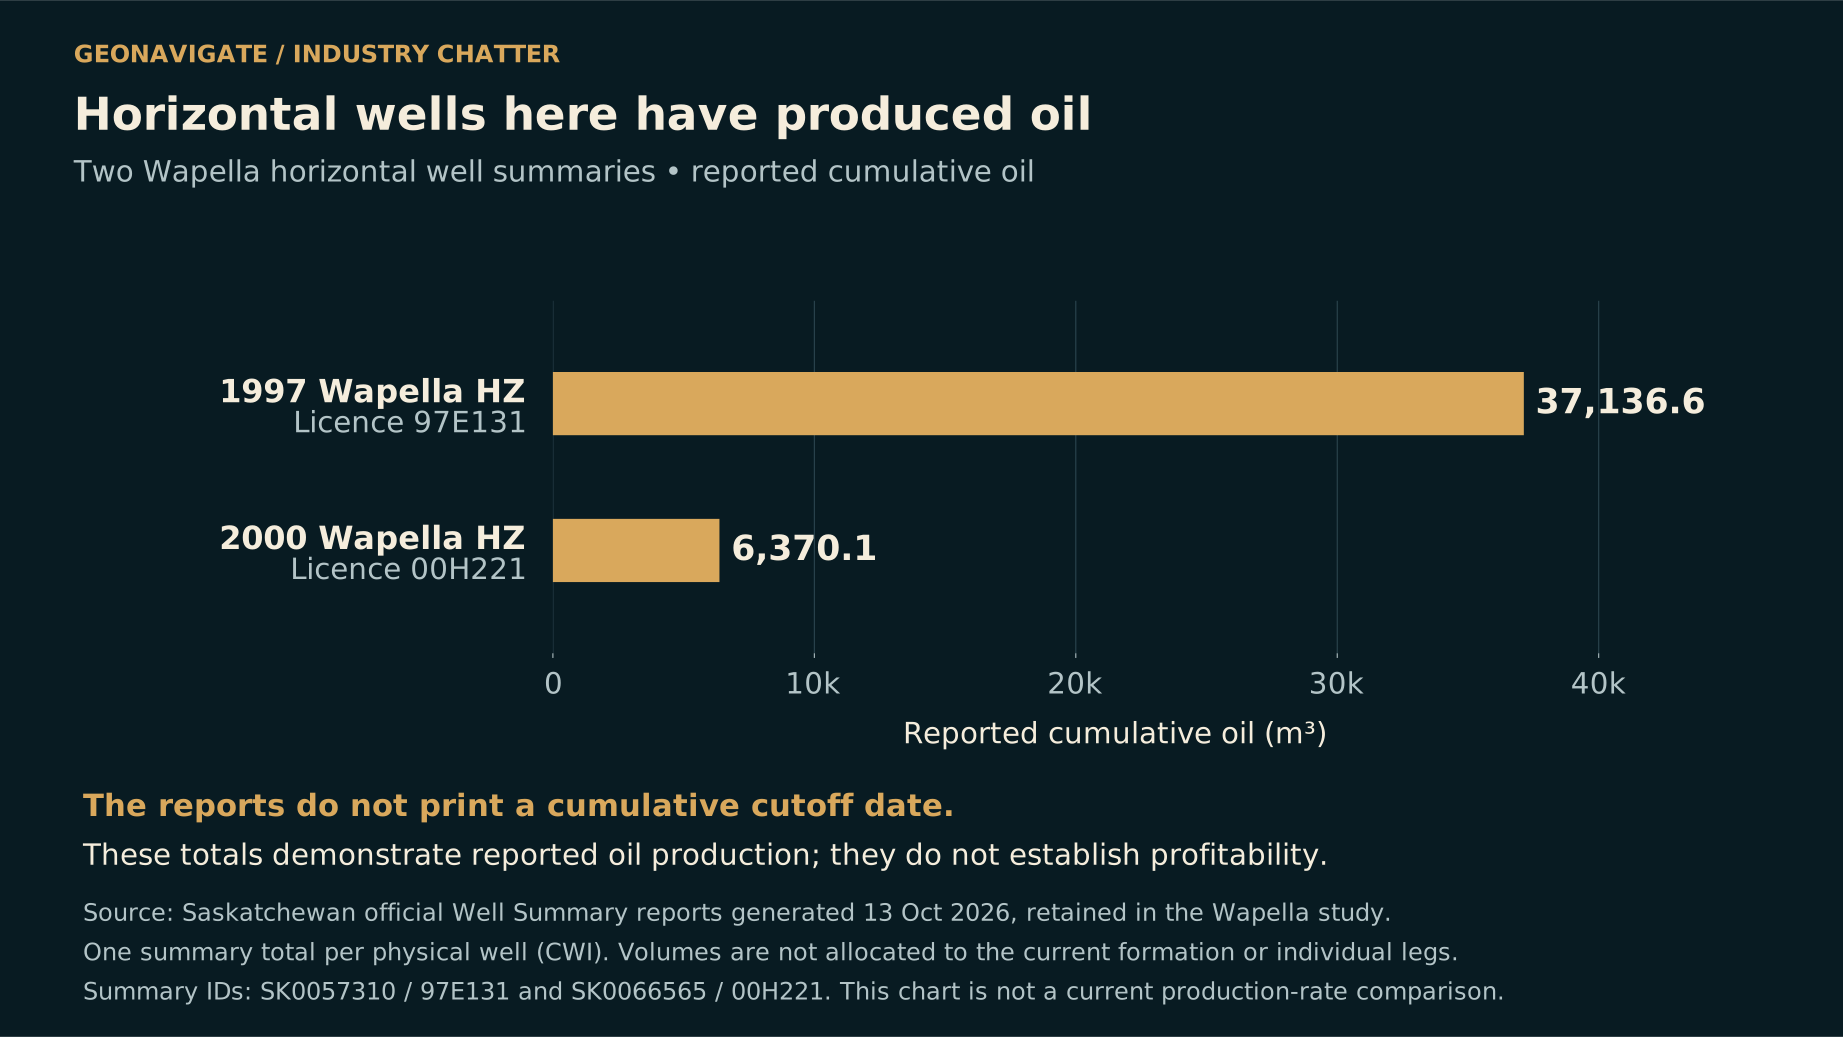
Two bars report cumulative oil of 37,136.6 and 6,370.1 cubic metres from retained summaries for horizontal-well licences 97E131 and 00H221.
Original diagramReported cumulative oil in retained official well-summary snapshots generated on 13 October 2026. A production cutoff date is not printed. These totals are not automatically assigned to a current formation label, and neither total establishes profitability or the reason operations ended.Original explanatory graphic by GeoNavigate; historical, geological and data sources credited separately. Contains information licensed under the Government of Saskatchewan Standard Unrestricted Use Data Licence (Version 2.0). · Original GeoNavigate explanatory artwork. · Image record ↗

So, would horizontal drilling work at Wapella?

First, it has already been tried. Two recorded Mannville horizontals began production in nineteen ninety-seven and two thousand. Their licence numbers are shown on screen so the cases can be checked.

The earlier well, ninety-seven E one three one, has about thirty-seven thousand one hundred cubic metres of cumulative oil in the recovered government-summary snapshot. The other, zero zero H two two one, has about six thousand four hundred cubic metres.

The summaries also contain substantial cumulative water volumes. The records have no printed production cutoff date, and these well-summary totals are not automatically attributable to today's formation label alone.

The later registry statuses are abandoned for one well and suspended for the other. Those statuses do not explain why operations ended, or whether either project earned an adequate return.

What the evidence does establish is that horizontal drilling at Wapella is not a new, untested concept. The next step is to understand the particular reservoir, completion and operating history of each case, rather than treating a final status label as a verdict on the whole technology.

Chapter sources511

CHAPTER 10

Where a horizontal could help
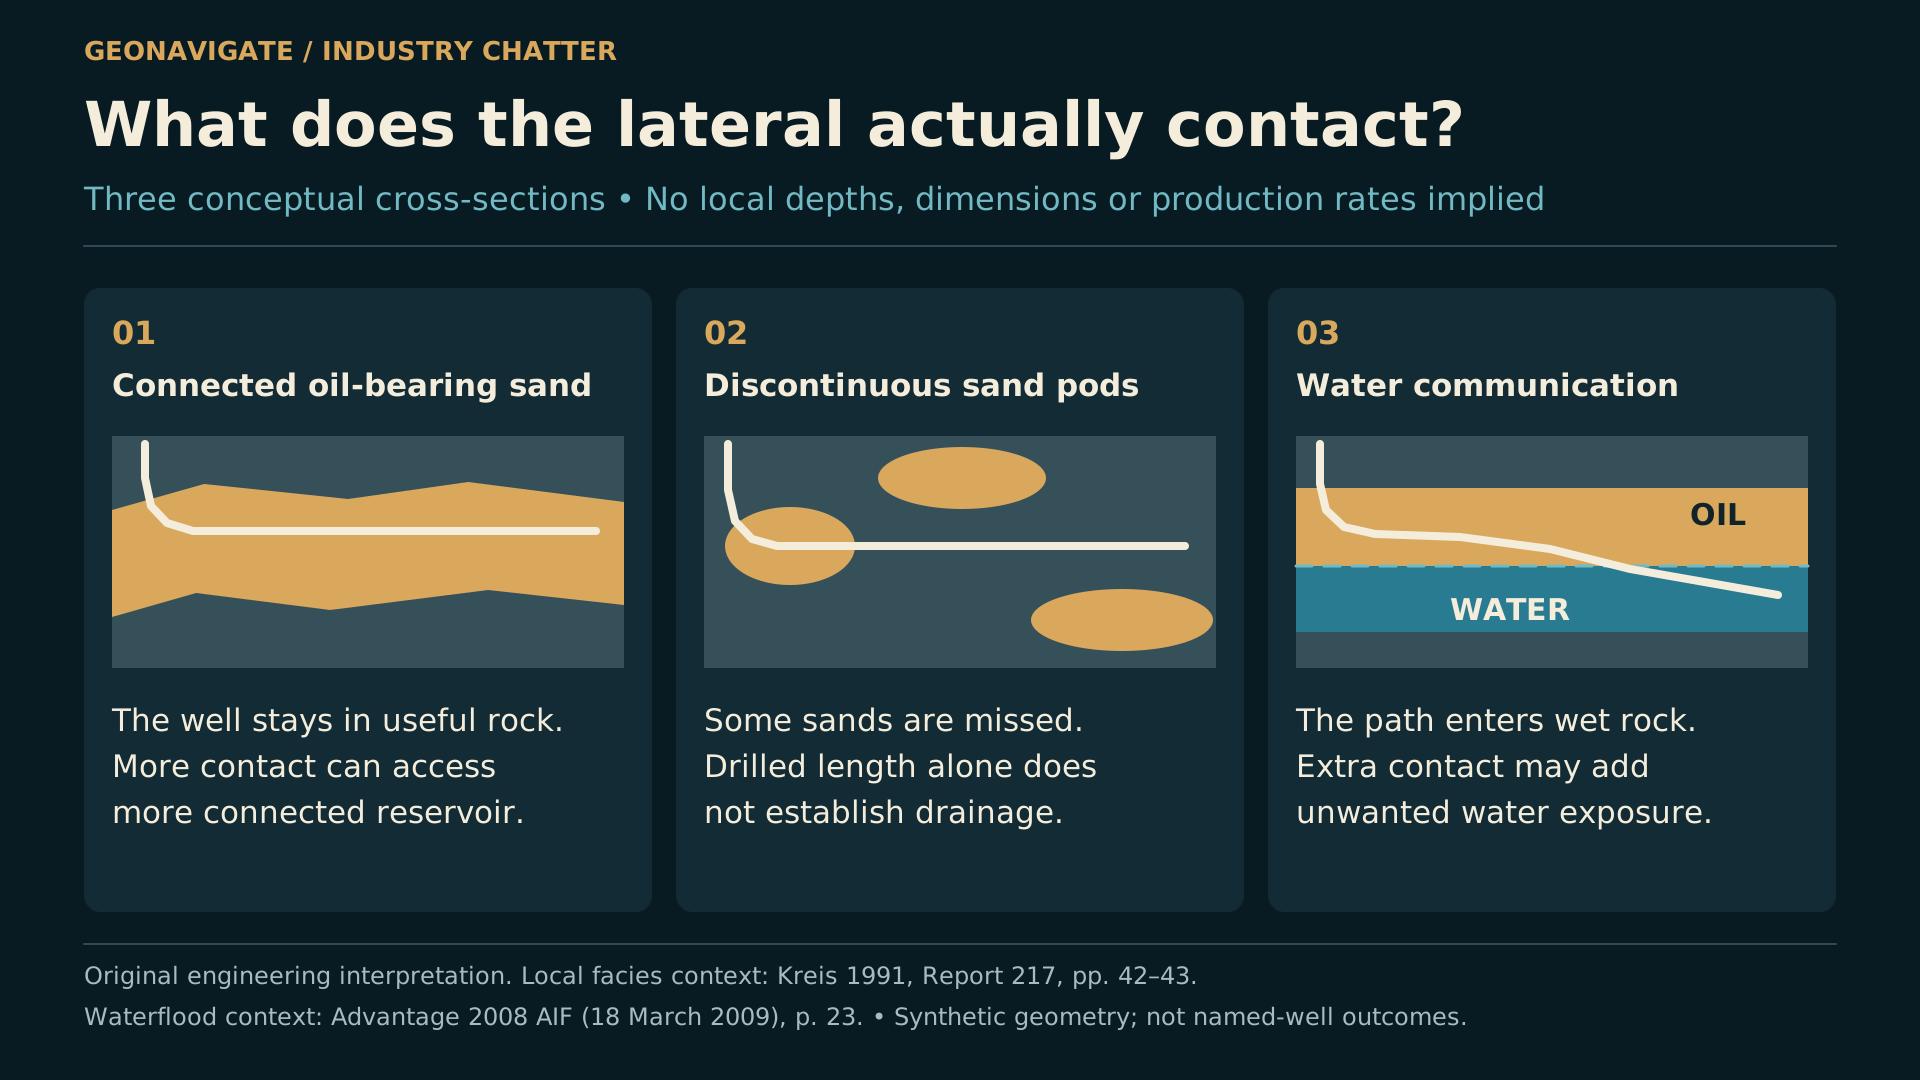
Three conceptual horizontal paths compare connected oil-bearing sand, disconnected sand lenses and water exposure.
Original diagramA longer lateral helps only where it adds useful connected reservoir contact. These three explanatory cases distinguish continuous pay, isolated sand bodies and water exposure. They are not local trajectories or forecasts.Original explanatory graphic by GeoNavigate; historical, geological and data sources credited separately. · Original GeoNavigate explanatory artwork. · Image record ↗

A horizontal well has a clear geological advantage when useful reservoir extends along the planned path.

Imagine a connected, oil-bearing channel sand. A vertical well crosses only its thickness. A carefully placed lateral can remain within that same body for a much greater distance, increasing contact with rock that can deliver fluid.

But contact length is useful only where the pores communicate, sufficient oil remains, and the pressure system supports production.

That makes channel geometry important. A lateral along a connected sand body's length may have a different outcome from one drilled across repeated sand-body edges. The best direction has to come from the local evidence; it is not automatically the road direction, the regional trend, or a line joining two producers.

A thicker connected package might support more steering tolerance. A thin, discontinuous lens could offer much less room.

The comparison should also include vertical infill and selective recompletion. Where several productive sands are stacked, those alternatives may access intervals that one lateral misses. The appropriate well shape follows the reservoir architecture and the development objective.

Chapter sources12

CHAPTER 11

Where a horizontal could disappoint
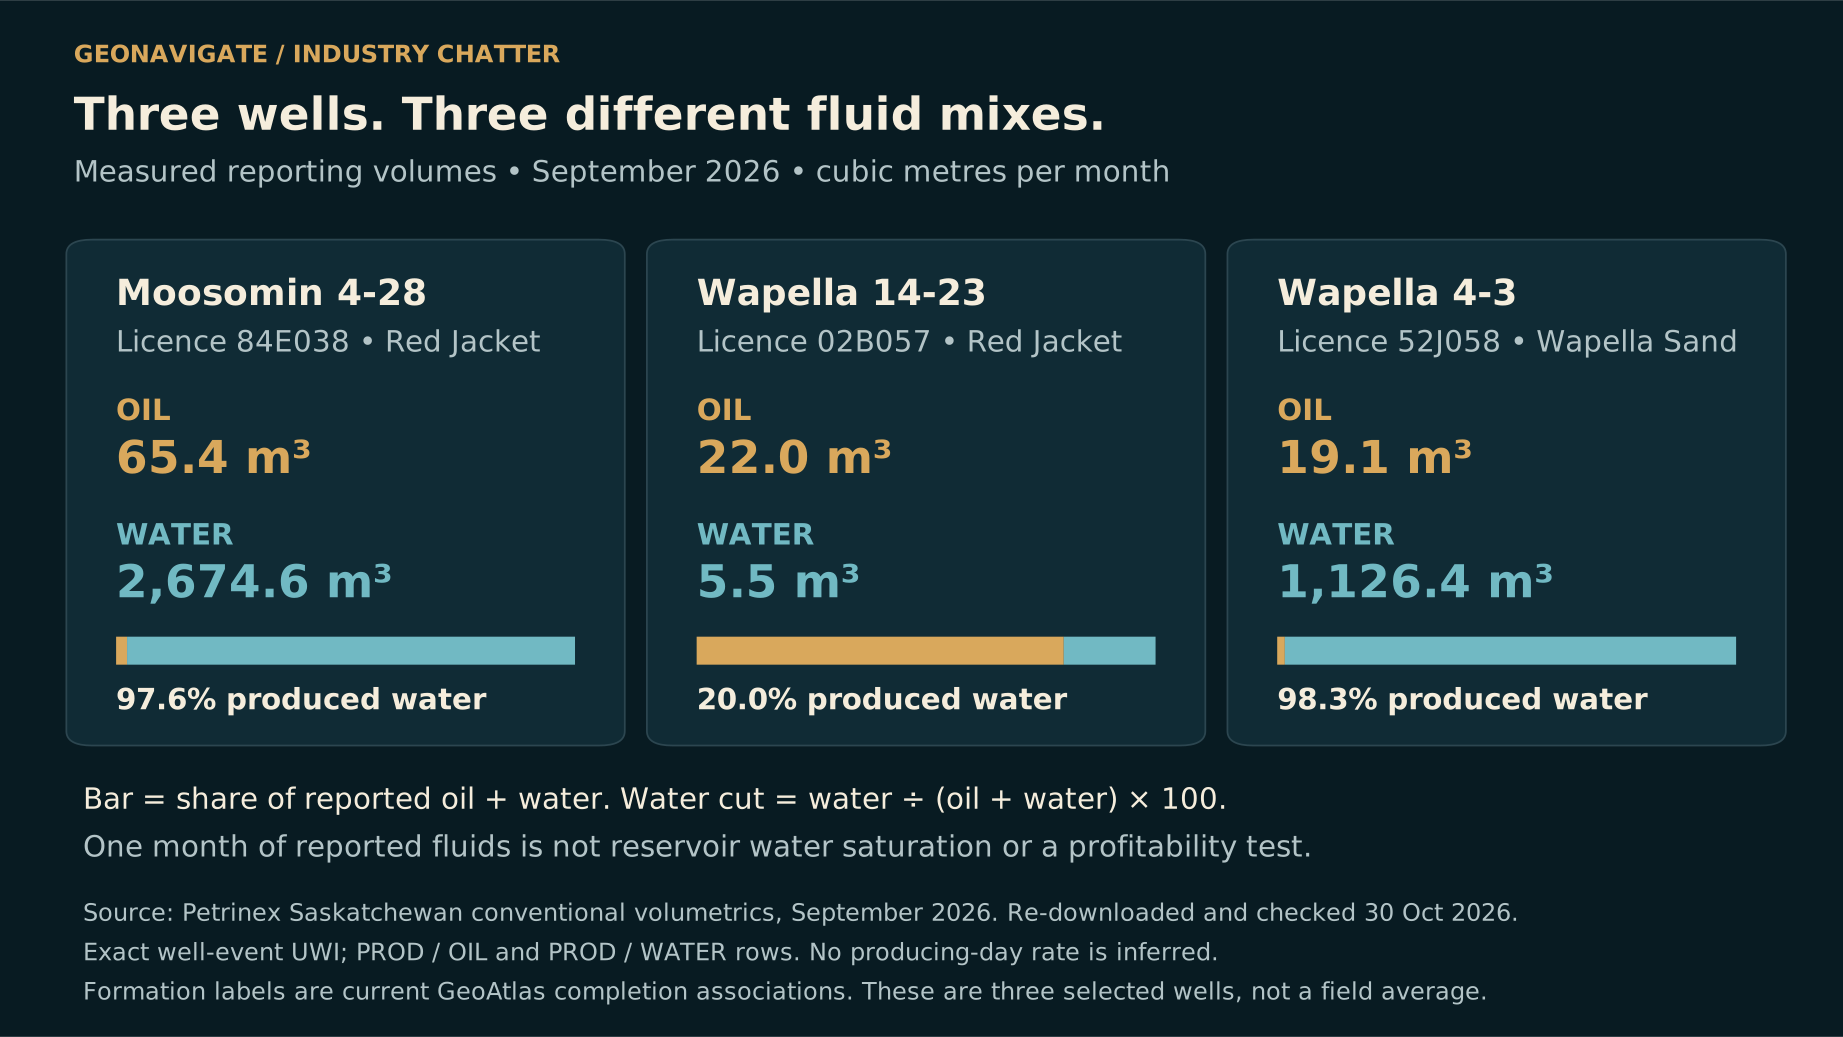
Equal-length percentage bars compare September 2026 reported oil-plus-water mixes for Moosomin 4-28, Wapella 14-23 and Wapella 4-3.
Original diagramCompletion-level September 2026 volumes in cubic metres. The bars show composition, not total produced volume: water fractions are approximately 97.6%, 20.0% and 98.3%, respectively. These are neither equal-age trials nor producing-day rates, reservoir saturations or predictions for a new horizontal.Original explanatory graphic by GeoNavigate; historical, geological and data sources credited separately. Data: Petrinex and Saskatchewan GeoAtlas. Contains information licensed under the Government of Saskatchewan Standard Unrestricted Use Data Licence (Version 2.0). · Original GeoNavigate explanatory artwork. · Image record ↗

Now imagine the same lateral crossing out of the channel into mudstone or tightly cemented sandstone. Drilling another hundred metres does not create another hundred metres of productive contact.

A different problem occurs when the lateral meets a water-bearing part of the reservoir, or a part already swept by earlier production and injection. More exposed rock can mean more water as well as more oil.

The dated production records show how variable fluid handling can be. Moosomin four twenty-eight's September twenty twenty-six volumes correspond to about ninety-seven point six percent water in its reported oil-plus-water total.

Wapella fourteen twenty-three, a different Red Jacket completion, reported twenty-two cubic metres of oil and five point five cubic metres of water that month. That is twenty percent water.

These are monthly completion-level comparisons, not equal-age trials or predictions for a new well. They do not identify the cause of the water.

They do explain why location-specific water contacts, pressure information, injection history and completion records belong beside the geological model. A regional statement that the sand produces oil is not enough to design the next lateral.

Chapter sources126

CHAPTER 12

The geosteering problem, in metres

For a geosteering specialist, small angular differences become very concrete over distance.

Consider a purely illustrative calculation, not a measured local well. Across five hundred horizontal metres, a constant error of one tenth of a degree in the assumed bed dip produces about zero point eight seven metres of vertical separation. Half a degree produces about four point three six metres.

Those numbers come from geometry. They are not local formation thicknesses or forecasts.

The practical point is that a seemingly small correlation error can matter in a thin target. And the cause of a changing log response may be structure, a facies change, cementation, or an eroded boundary.

Gamma ray helps correlate rock patterns. It is not a direct measurement of an oil-water contact. Core and offset logs establish the geological meaning of the pattern; other measurements and testing help establish fluids and connectivity.

Good steering therefore needs two questions at once. Are we staying in the intended stratigraphic position? And is the material at that position still the reservoir we intended to contact? Steering can improve placement. It cannot restore a sand body that has pinched out.

Chapter sources127

CHAPTER 13

Drilling issues: what the records actually establish
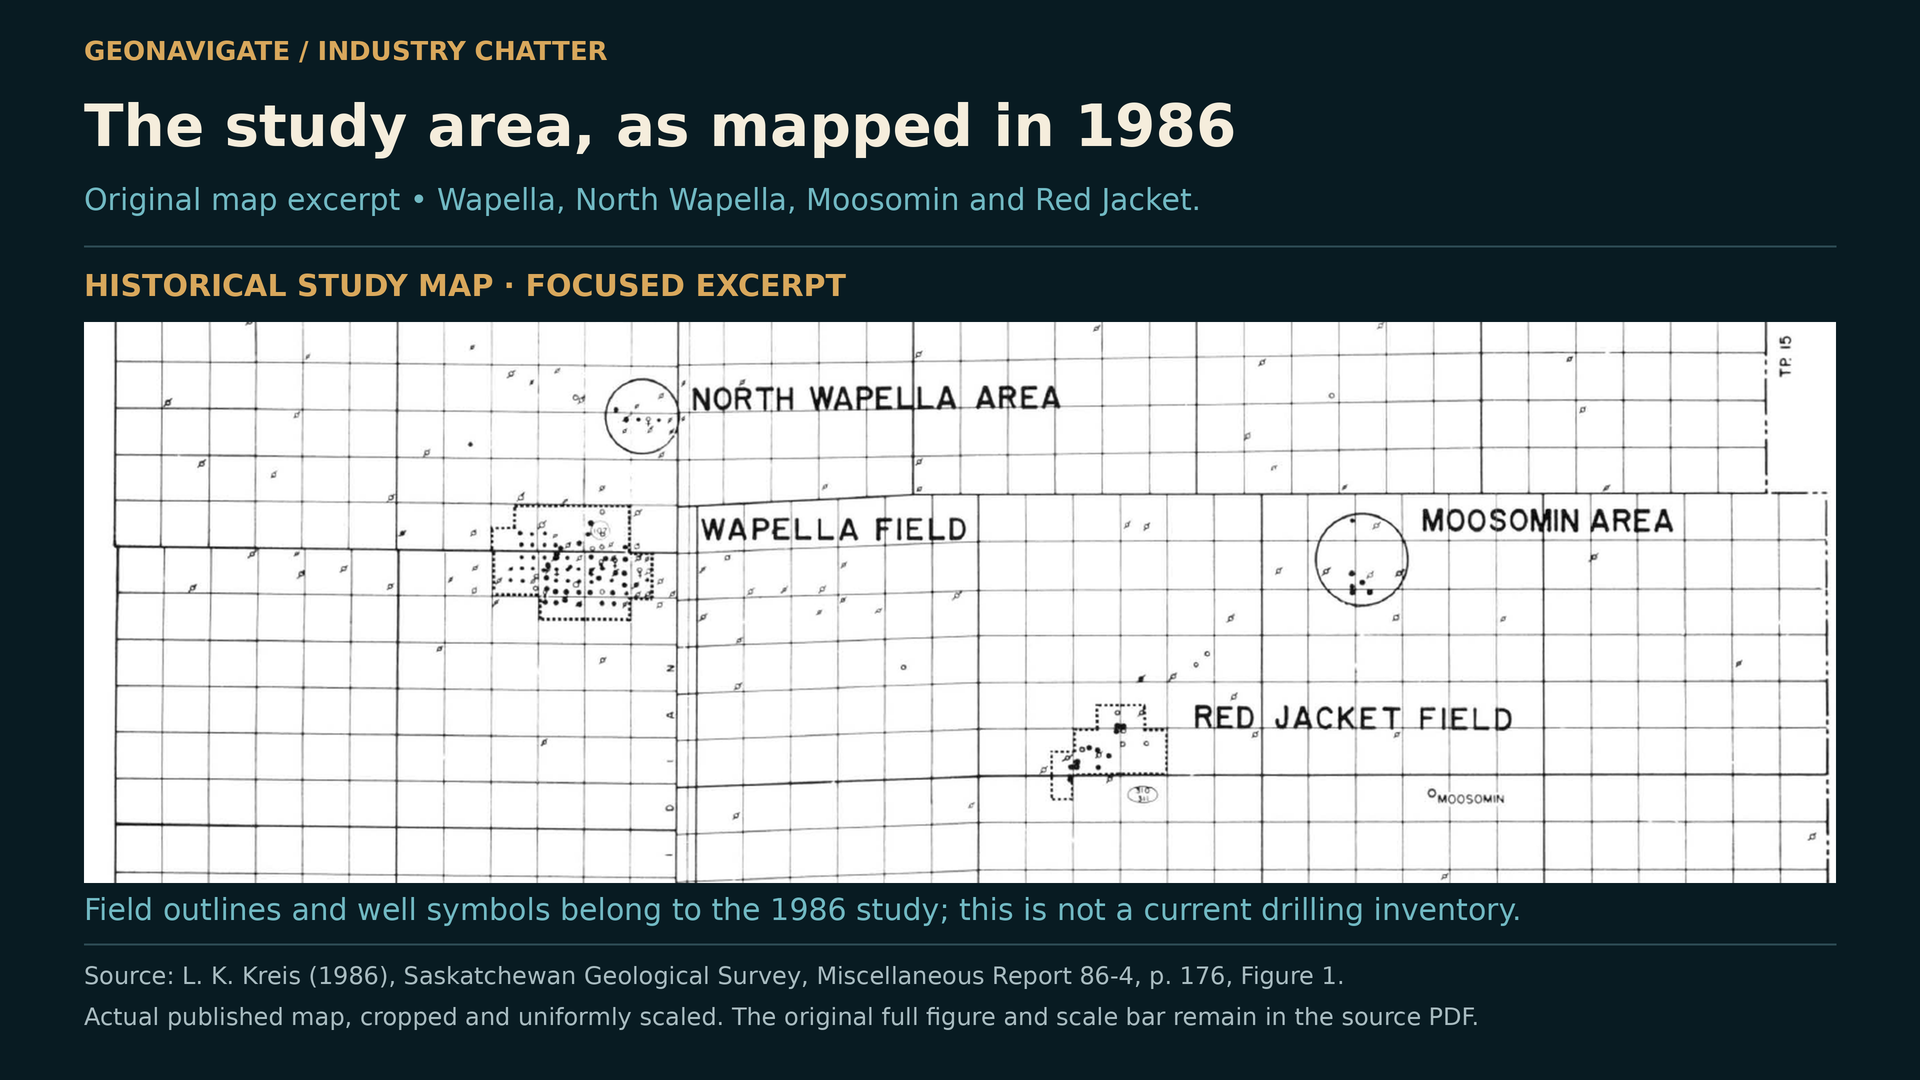
Focused excerpt of the 1986 Wapella–Moosomin study-area map with historical formation and well symbols.
Episode visualKreis (1986), Figure 1, p. 176. This source excerpt documents the historical study area and report-era interpretation. It is not a current well inventory, modern geological survey or evidence of a particular drilling incident; the complete original map and scale bar remain in the source PDF.L. K. Kreis / Saskatchewan Geological Survey; explanatory presentation by GeoNavigate. · Image record ↗

What about stuck pipe, losses, hole instability, or a well that had to be abandoned while drilling?

Those are legitimate questions for the local history. The sources recovered for this episode do not authenticate specific incidents of that kind in the named early wells.

A long interval between spud and completion is not proof of downtime. An abandoned status does not identify a mechanical failure. And an unsuccessful production test is not the same thing as an accident on the rig.

The documented lower Gravelbourg problem at Moosomin was poor reservoir quality. The published geology also establishes difficult correlations, abrupt rock changes and erosion. Those are real challenges, and they are enough to make the drilling story interesting without inventing an operational disaster.

To reconstruct individual drilling problems, the next evidence would be daily drilling reports, original well files, test details and completion histories. Those could reveal whether a result was controlled by the rock, the chosen interval, the completion, or an operational event.

For now, the film keeps observed well history separate from engineering scenarios. The distinction makes the eventual explanation stronger.

Chapter sources9512

CHAPTER 14

Beyond Wapella: nearby horizontals with reported oil
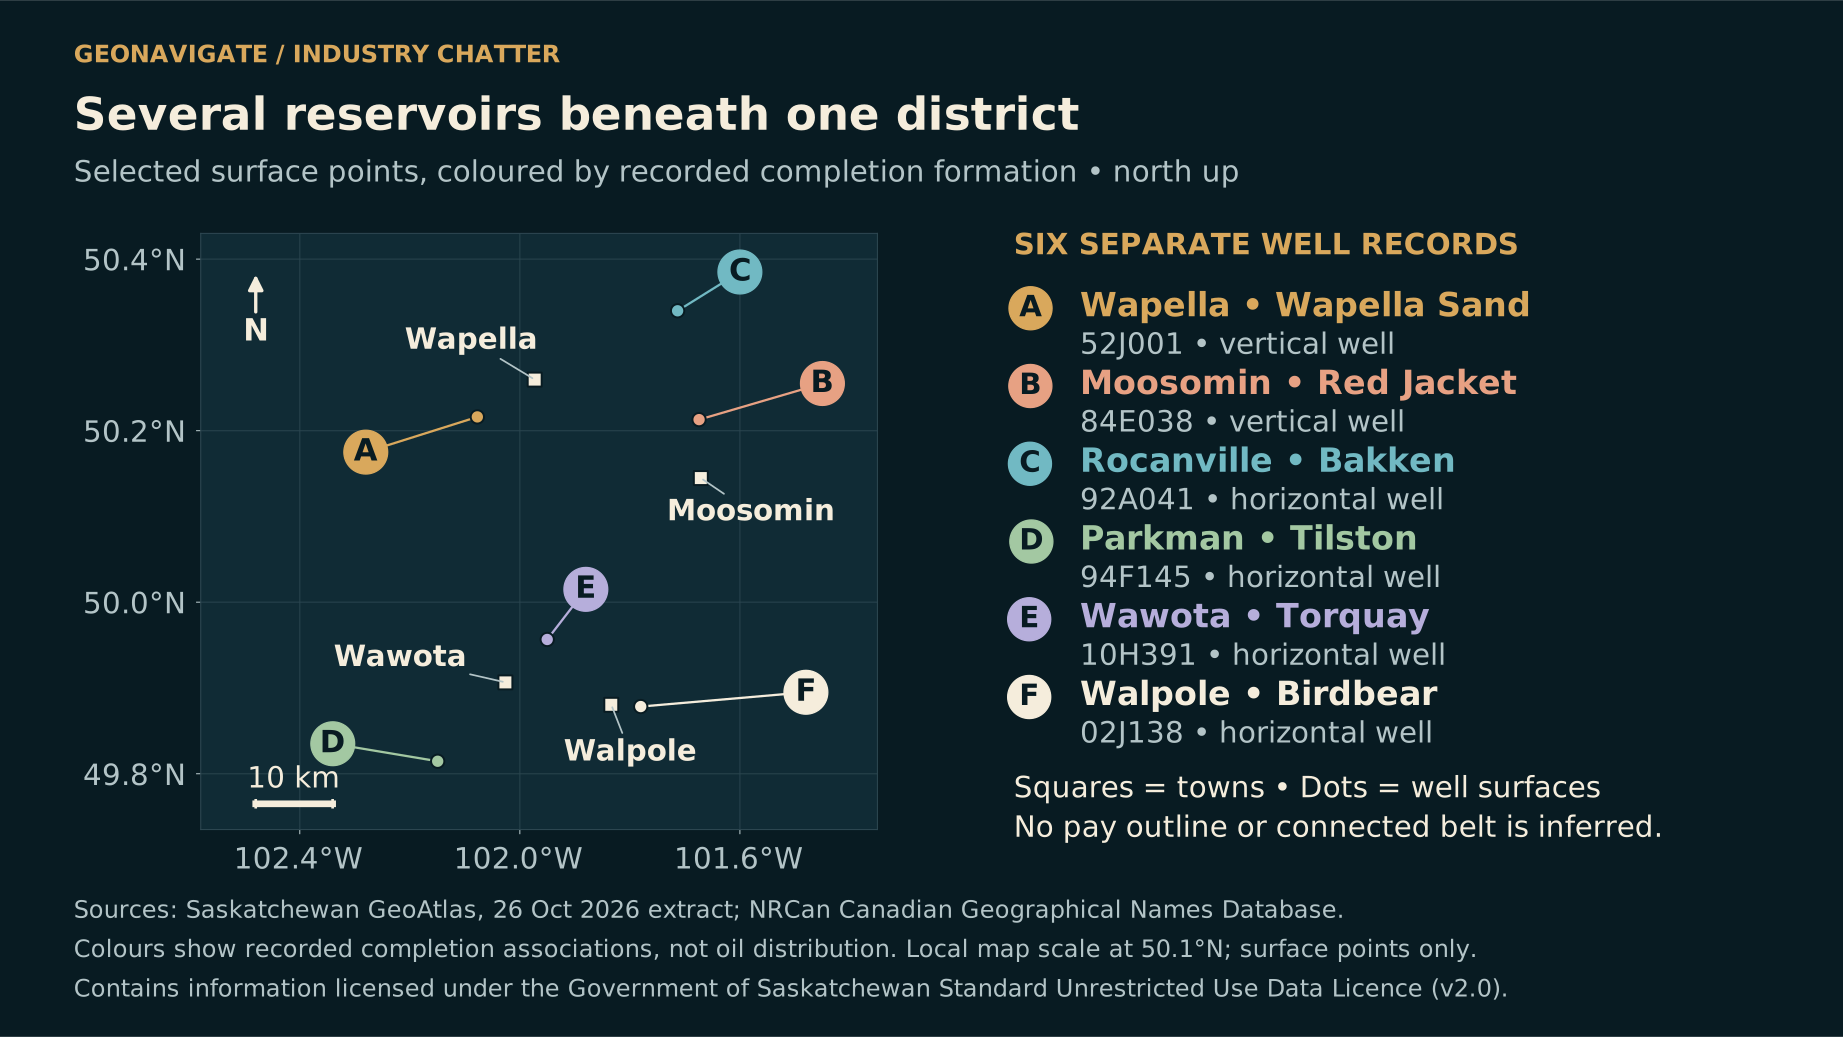
Regional map locates selected Wapella, Moosomin, Rocanville, Parkman, Wawota and Walpole well cases with their distinct formation associations.
Original diagramSelected well-surface locations and formation-specific cases. Nearby oil-producing Bakken and Tilston horizontals demonstrate horizontal activity in those settings; they do not establish Red Jacket performance. Geographic proximity is not a continuous reservoir connection.Original explanatory graphic by GeoNavigate; historical, geological and data sources credited separately. Contains information licensed under the Government of Saskatchewan Standard Unrestricted Use Data Licence (Version 2.0). · Original GeoNavigate explanatory artwork. · Image record ↗

Moving toward Rocanville, Wawota and Parkman broadens the opportunity, but it also changes the rocks.

A Rocanville Bakken horizontal, licence ninety-two A zero four one, has a nineteen ninety-two on-production date. Its September twenty twenty-six record reported one hundred cubic metres of oil.

A Parkman Tilston horizontal, licence ninety-four F one four five, has a nineteen ninety-four on-production date and reported one hundred and thirty-three point eight cubic metres of oil that September. Both also produced water.

These examples establish reported oil production from specific nearby horizontals. They do not prove a new Red Jacket lateral would perform the same way, or that the old wells are currently profitable.

Parkman's published reservoir model concerns a Mississippian carbonate trap shaped by erosion and preserved relief near the Tilston subcrop. That is a different geological problem from following a Jurassic tidal sandstone.

For Wawota, the government's twenty-ten orders also document Torquay horizontal projects. An authorization records a development proposal; actual drilling and production still require the corresponding well records.

The wider area contains several horizontal-drilling stories. We should keep their formations and evidence separate.

Chapter sources561314

CHAPTER 15

Walpole–Wawota: several exploration ideas
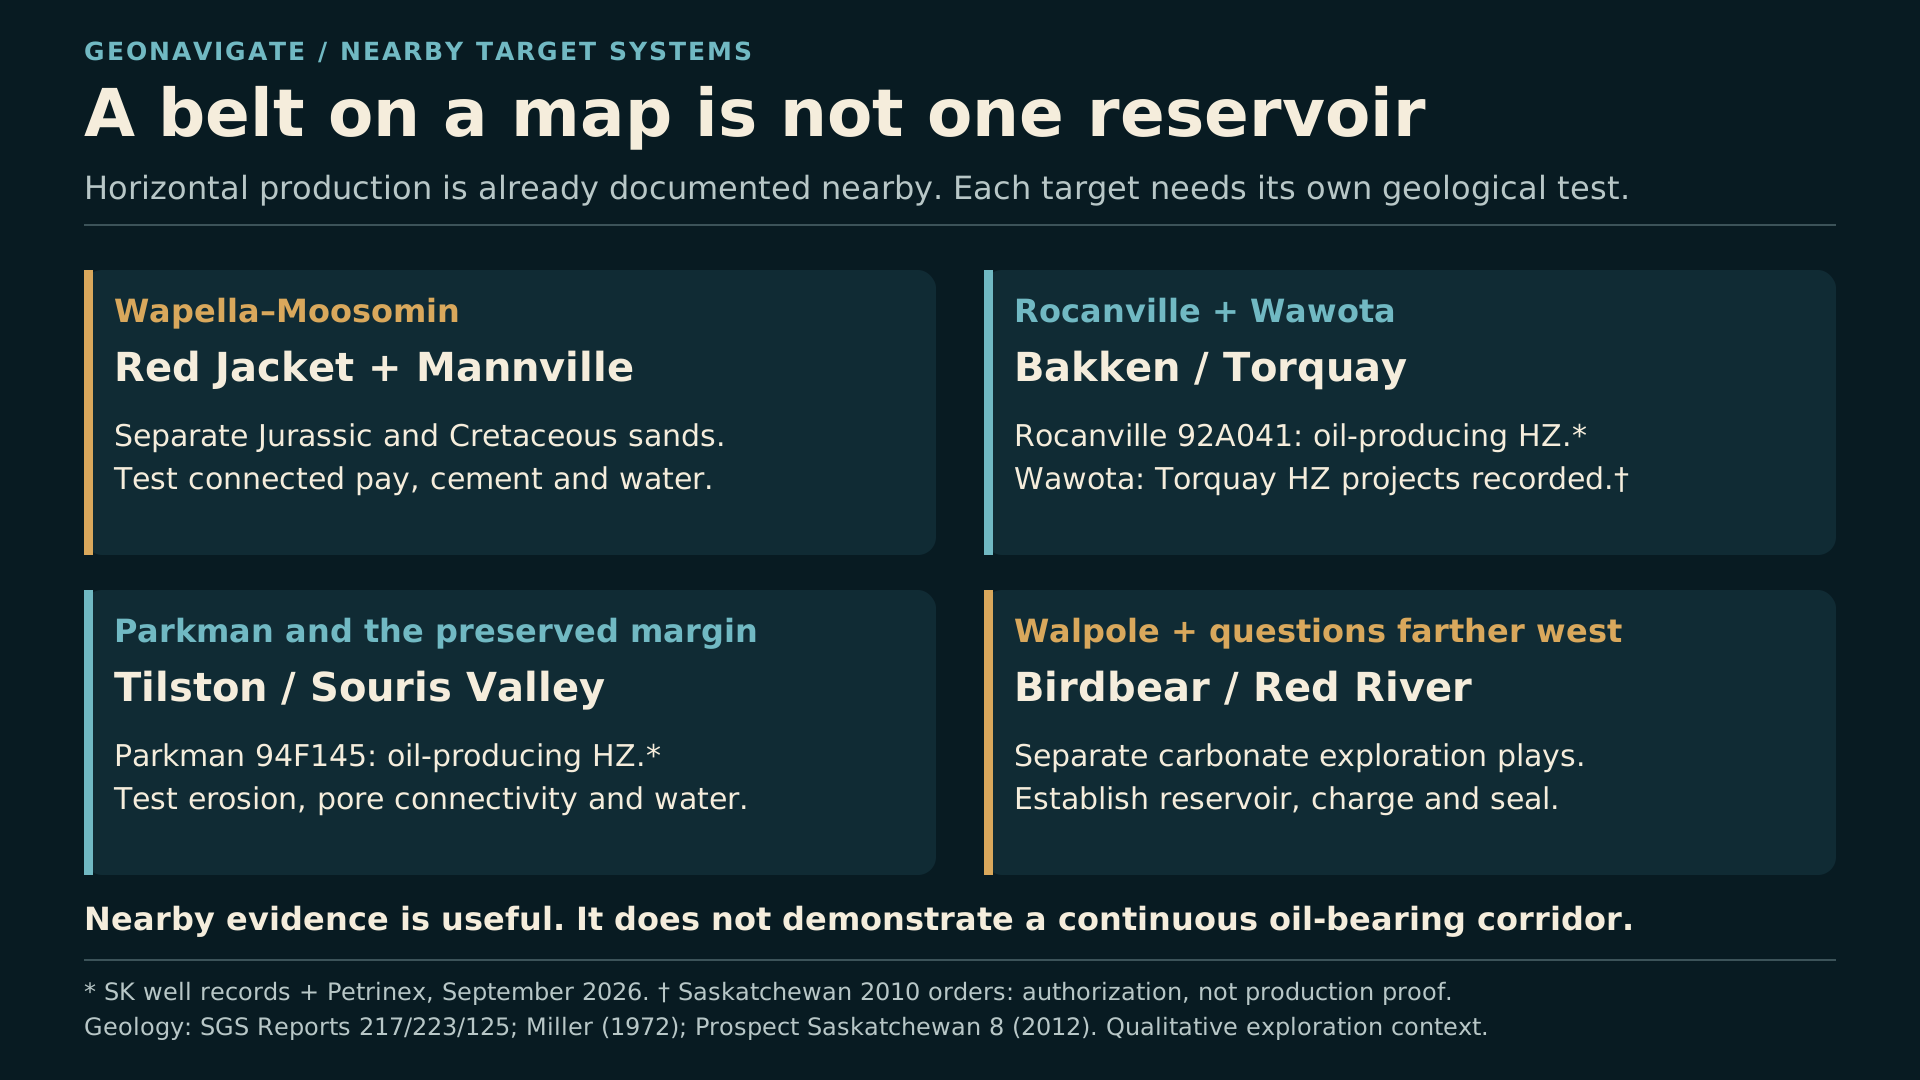
Parallel panels distinguish Mannville, Red Jacket, Tilston, Bakken/Torquay, Birdbear and Red River exploration questions.
Original diagramWalpole–Wawota spans several exploration questions. Sandstone architecture, carbonate preservation and pore systems, charge and seals require separate evidence. The panels are a conceptual comparison, not a prospect ranking or a demonstrated continuous oil belt.Original explanatory graphic by GeoNavigate; historical, geological and data sources credited separately. · Original GeoNavigate explanatory artwork. · Image record ↗

The Walpole–Wawota idea is most useful as a group of exploration questions.

For the sandstone systems toward Wapella, Whitewood and Broadview, the task is to identify preserved sand bodies, their seals and a credible path for oil to reach them. A nearby oil show is a lead, not proof that the next sand body is charged.

For Mississippian carbonates near Parkman, preserved relief, pore connectivity and seal geometry matter. Apparent structural closure alone may not describe the whole trap.

For the Devonian Birdbear around the broader belt, reservoir quality and charge need their own assessment. A porous-looking dolomite is not automatically permeable, and properties measured in a distant pool cannot simply be transferred to Walpole.

Farther-west Red River opportunities are another separate petroleum system. They do not extend a shallow Wapella sandstone play into one continuous oil-bearing strip.

That separation is productive. It lets an explorer test competing ideas against core, logs, seismic and actual fluid evidence. It also creates clear rejection tests: the sand may be absent, the pore system poor, the seal breached, or the reservoir uncharged.

A promising regional story becomes useful when it makes specific predictions that a well or a dataset can challenge.

Chapter sources815161417

CHAPTER 16

The next well begins with the existing evidence
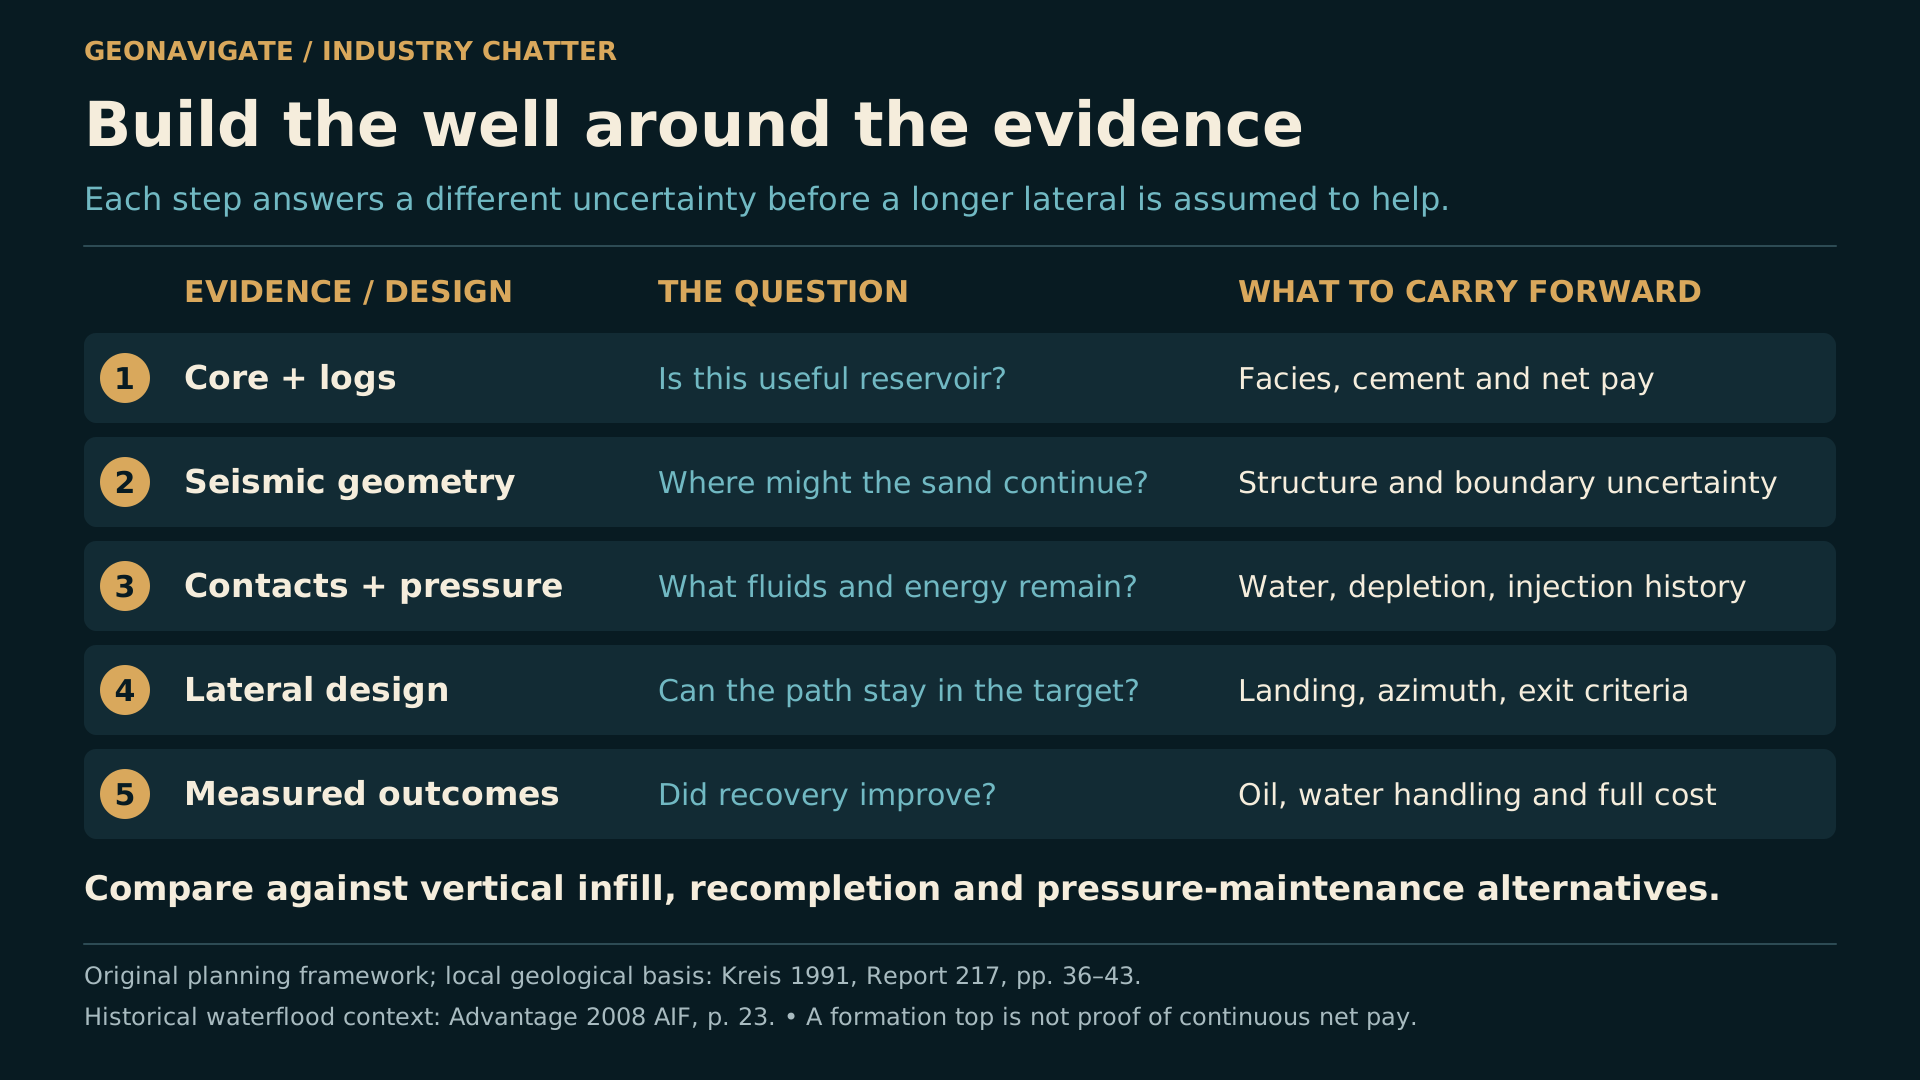
A conceptual evidence workflow links exact well identity, interval and production history, reservoir connection, fluids and pressure, and alternative well designs.
Original diagramAn original framework for screening a new location: reconcile the existing well and completion evidence, determine connected reservoir and fluids, then compare horizontal placement with vertical infill or selective recompletion. This is not an approved well program or a local performance forecast.Original explanatory graphic by GeoNavigate; historical, geological and data sources credited separately. · Original GeoNavigate explanatory artwork. · Image record ↗

What would make the next investigation worthwhile?

Start with the old wells. Match names to stable identifiers. Recover the original logs, core descriptions, tests and completion history. Keep oil shows separate from sustained production, and preserve the dates behind every volume.

Then map the reservoir at the scale of the decision. Identify which sands or carbonate intervals are present, how their quality changes, where erosion removes them, and how confidently their boundaries are known.

Use pressure and fluid evidence to ask whether the useful rock is still connected and oil-bearing. Only then compare a horizontal path with vertical infill, recompletion, or another recovery approach.

Wapella's commercial story began with separate Cretaceous and Jurassic discoveries in nineteen fifty-two. Later wells, additional reservoirs and decades of production made it much more than a brief exploration headline.

The next chapter will depend on understanding those differences. Horizontal drilling can be part of the answer where the reservoir supports it. In another location, a different well design may be more effective.

For a hometown oilfield, the strongest story is already in the records: what the early drillers found, what the rocks reveal, and what remains worth testing. This is GeoNavigate Industry Chatter.

Chapter sources12109

THE VISUAL STORY

Episode visuals

Reconstructions and conceptual diagrams are identified in their captions.

FOLLOW THE EVIDENCE

Sources & notes

  1. J. F. Caley — The Canadian Mineral Industry, 1952, petroleum chapter, p. 194

    Contemporary federal account of Tide Water Associated Oil Co. Wapella 9-33 and Imperial–Tide Water Wapella 4-3. The approximately 100 and 75 barrels/day figures describe initial test capacity or potential, not sustained output. Depths and productive intervals are the source’s approximate well-specific values. The original drilling company is not inferred from a later registry name.

    H01
  2. Department of Mines and Technical Surveys — The Canadian Mineral Industry, 1953, p. 229

    The Important Oil Fields in Saskatchewan table dates the Wapella Lower Cretaceous discovery to October 1952 and Jurassic discovery to December 1952. These are discovery milestones; an on-production date can be later. This commercial discovery sequence does not establish the first exploratory hole ever drilled anywhere in the wider district.

    H02
  3. Saskatchewan Legislative Assembly — Hansard, 2 March 1953, p. 1, Re Oil Discovery

    Minister J. H. Brockelbank reported favourable drillstem-test recoveries at Sohio Wapella 9-34 and a contemporary field tally of nine wells drilled, eight considered producers and one dry hole. The tally is an attributed 1953 statement, not a lifetime success ratio; the announcement does not establish uninterrupted three-zone production.

    H03
  4. Dominion Bureau of Statistics — The Crude Petroleum and Natural Gas Industry, 1953, Table 5, p. H-4

    Wapella field output was 4,804 barrels in 1952 and 96,614 barrels in 1953. These are annual field totals, not individual-well or per-day rates. The 1952 total covers a partial production year after the autumn discovery. Their ratio is not a like-for-like improvement in discovery-well performance.

    H04
  5. Government of Saskatchewan — GeoAtlas Petroleum well and completion records

    Records were cross-checked using stable WELLBORE_CWI identifiers, licences, land descriptions and completion identifiers. A later operator/name or current formation association does not establish the original driller or allocate every historical volume to that formation. Map points are well-surface locations, not horizontal trajectories or bottomholes. The editorial regional selection is not an official field boundary. Contains information licensed under the Government of Saskatchewan Standard Unrestricted Use Data Licence (Version 2.0).

    GIS
  6. Petrinex — Saskatchewan September 2026 conventional volumetrics

    Selected oil and water volumes are reported at matched completion/activity level for September 2026, in cubic metres. Produced-water fraction is water divided by reported oil plus water, not reservoir water saturation. Monthly totals are not producing-day rates, lifetime recovery, matched-age trials or economic results. Well/formation associations come from the Saskatchewan registry. The broader 2022–2026 data window is not a lifetime production record.

    PX
  7. L. K. Kreis — The Red Jacket Formation of Southeastern Saskatchewan, 1988, pp. 211–223

    The Jurassic Red Jacket contains Rocanville, Moosomin and Burrows members; lower Gravelbourg is a separate underlying interval. Abrupt facies changes and erosion complicate correlation. The Burrows shale marker is locally absent through erosion. Southwestern lateral equivalents should not be drawn as extra vertically stacked local units. The stratigraphic diagram is qualitative and omits some units and boundaries.

    K88
  8. J. E. Christopher — Jura-Cretaceous Success Formation and Lower Cretaceous Mannville Group of Saskatchewan, Report 223, 2003, p. 104

    Describes the younger Wapella Mannville/Dina reservoir as a paleovalley tributary against Jurassic relief. Average net pay of 5.86 m and porosity of 27.9% are historical report-era pool values, not values for every location or current prospect. The passage does not print a cumulative-production cutoff. Original oil in place, recoverable oil and cumulative production are different categories. The episode’s paleovalley graphic is conceptual, with no measured local orientation or thickness.

    C03
  9. L. K. Kreis — Stratigraphy of the Jurassic System in the Wapella–Moosomin Area, Report 217, 1991

    Primary local depositional study: estuarine, lagoonal and tidal-flat/channel interpretations on pp. 36–38; an interval-specific lower Gravelbourg production attempt abandoned for poor reservoir quality at Moosomin 4-28 on p. 42; discontinuous sandstone lenses and seals on p. 43. Core photographs on pp. 70 and 75 are actual source images, not AI reconstructions. The proposed south/west barrier was untested with the study’s well control. Patchy sandstone alone does not establish turbidites. No named local stuck-pipe, lost-circulation or blowout incident was authenticated in the recovered sources.

    K91
  10. L. K. Kreis — Development of a Depositional Model for the Oil-Prone Jurassic Section in the Wapella–Moosomin Area, 1986, pp. 176–178

    Historical study map: Figure 1, p. 176. Actual SP/resistivity log: Figure 2, p. 177, Tricent et al. Red Jacket 11-4-14-32W1, showing two productive intervals. This log is not Moosomin 4-28. Study-era well counts and mapped outlines are historical. Source excerpts retain original geological detail and are not modern surveys, reservoir simulations or AI-enhanced logs.

    K86
  11. Government of Saskatchewan — public well-summary records, retained Wapella snapshots

    Retained official summaries generated 13 October 2026 identify licence 97E131 with 37,136.6 m³ cumulative oil and 1,251,895.9 m³ water, and 00H221 with 6,370.1 m³ oil and 185,653.7 m³ water. The summaries print no production cutoff date. These physical-well totals are not automatically allocated to today’s Mannville association. The records establish historical horizontal activity and nonzero oil; later abandoned/suspended labels do not establish failure cause or profitability. Contains information licensed under the Government of Saskatchewan Standard Unrestricted Use Data Licence (Version 2.0).

    ATLAS
  12. GeoNavigate — original reservoir and geosteering explanations, with local context from Kreis (1991)

    The connected-sand, isolated-lens, water-exposure and well-planning diagrams are original explanations informed by the cited local geology, not measurements or predictions for a proposed local well. The illustrative geometry is 500 × tan(dip error): 0.1° gives about 0.8727 m and 0.5° gives about 4.3634 m vertical separation. Those are neither local formation thicknesses nor measured trajectories. Gamma ray supports lithological correlation; it is not a direct oil-water-contact measurement. Vertical infill and selective recompletion remain comparison options.

    TECH
  13. Government of Saskatchewan — Public Notices and Minister’s Orders Issued in 2010, p. 43

    MRO 505/10 lists Tundra Oil & Gas Partnership’s Wawota Area–Torquay Formation horizontal oil project. A regulatory authorization establishes project history; by itself it proves neither drilling completion nor production, recovery or economics.

    MRO10
  14. E. G. Miller — Parkman Field, Williston Basin, Saskatchewan, AAPG Memoir 16, 1972, publisher abstract

    Publisher abstract describes the Mississippian Tilston paleogeomorphic trap, erosion/preservation and the role of pore geometry and lithology. Only the available abstract was used, not an unread full chapter. Parkman’s carbonate setting is separate from the Wapella sandstone systems. Reported oil from a Parkman horizontal cannot establish Red Jacket performance.

    M72
  15. R. A. H. Nichols — The Petrology and Economic Geology of the Upper Devonian Birdbear Formation, Report 125, 1970

    Pages 27–29 distinguish carbonate pore connectivity and permeability. These are regional analogue observations, not measured Walpole reservoir values; Hummingbird values have not been assigned to Walpole. Porosity alone does not establish flow capacity, charge or recoverability.

    N70
  16. P. G. Lillis — Review of oil families and their petroleum systems of the Williston Basin, 2013, USGS publication record

    The abstract distinguishes oil families and source-system relationships, including an unsettled documented oil/source correlation for Birdbear. It does not establish a settled local charge pathway or continuous productive trend beneath Walpole–Wawota.

    L13
  17. Government of Saskatchewan — Prospect Saskatchewan, Issue 8, April 2012, Red River Formation

    Describes a separate Ordovician carbonate exploration system. Red River, Birdbear, Mississippian targets, Bakken/Torquay, Jurassic Red Jacket and younger Mannville are distinct geological questions, not a demonstrated continuous oil belt.

    RR12
  18. Natural Resources Canada — Canadian Geographical Names Database, Wapella

    Representative named-place point used in the north-up location map, not a surveyed town boundary. The original map combines named-place points with Saskatchewan well-surface records and does not infer reservoir connections.

    MAP_WAPELLA
  19. Natural Resources Canada — Canadian Geographical Names Database, Moosomin

    Representative named-place point used for geographic context.

    MAP_MOOSOMIN
  20. Natural Resources Canada — Canadian Geographical Names Database, Wawota

    Representative named-place point used for geographic context.

    MAP_WAWOTA
  21. Natural Resources Canada — Canadian Geographical Names Database, Walpole

    Representative hamlet point used for geographic context; the named area is not equated with a single field or reservoir.

    MAP_WALPOLE
  22. Masterhatch — Red Lily Wind Farm, Moosomin, 30 January 2024, Wikimedia Commons

    CC0 modern photograph. Used only for present-day landscape context, not as an image of a historical discovery. Website copy is proportionally reduced to a maximum dimension of 1600 pixels; no cropping, AI enhancement or geological retouching.

    PHOTO